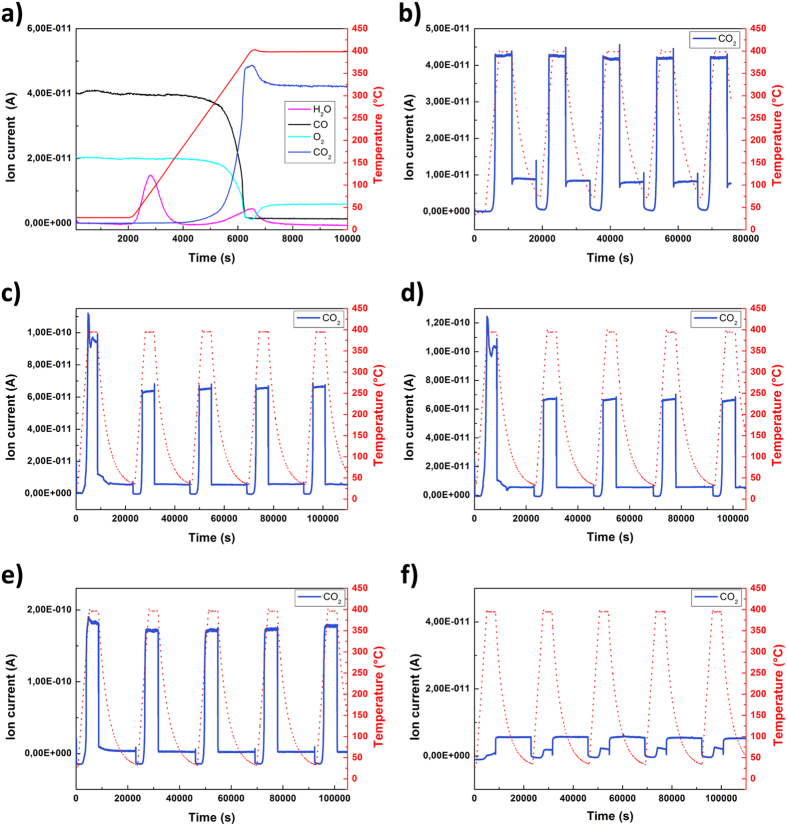
Figure 5. Temperature-controlled CO oxidation between 25 and 400 °C.
The graphs show the first temperature rise with an overview of all measured signals for (a) 0.2%Au0.5Pt0.5/SiO2 and the course of the CO2 signal of 5 measured cycles for (b) 0.2%Au0.5Pt0.5/SiO2, (c) 0.17%Au0.3Pt0.7/SiO2, (d) 0.18%Au0.1Pt0.9/SiO2, (e) 0.15%Pt/SiO2, and (f) 0.23%Au/SiO2.

