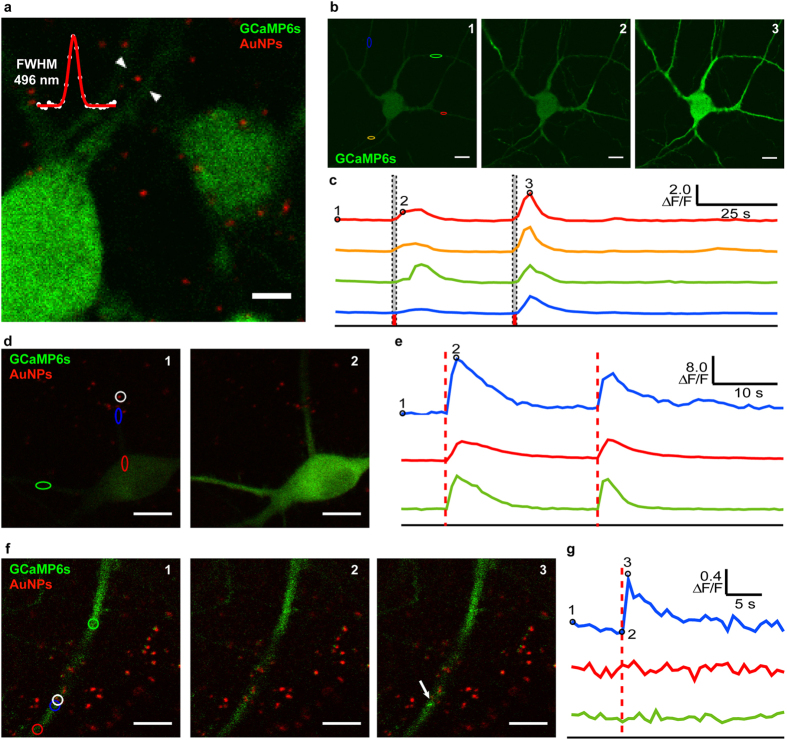
Figure 1. Neuronal stimulation with illumination of bare AuNPs.
(a) Fluorescence of GCaMP6s (green) and reflectance at 800 nm of the AuNPs (red). The measured full width at half maximum (FWHM) of the reflection PSF of a single AuNP is shown in the upper left corner. (b) Representative example from 21 neurons of the change in GCaMP6s fluorescence following a single scan of the whole imaging field with the NIR fs laser, at the time points indicated by the dotted lines in (c). The labels “1, 2, 3” indicate the timing of the images corresponding to those in (c). (c) Ca2+ signal (ΔF/F) over time in the respective colored regions marked in (b); red dotted lines indicate time of laser stimulation. (d,e) NALOS in a dendrite can trigger a cell-wide Ca2+ transient. (d) Fluorescence of GCaMP6s and reflectance of the AuNPs (red) prior to (1) and after (2) NALOS in the white circle. (e) Ca2+ signal (ΔF/F) over time in the respective colored regions marked in (d); red dotted lines indicate timing of laser stimulation. (f,g) NALOS with lower intensity in a dendrite can trigger highly localized Ca2+ transient. Same approach as in (d,e). Scale bars 10 μm. More detailed quantification of the observed Ca2+ after NALOS is shown in Suppl. Fig. 1.

