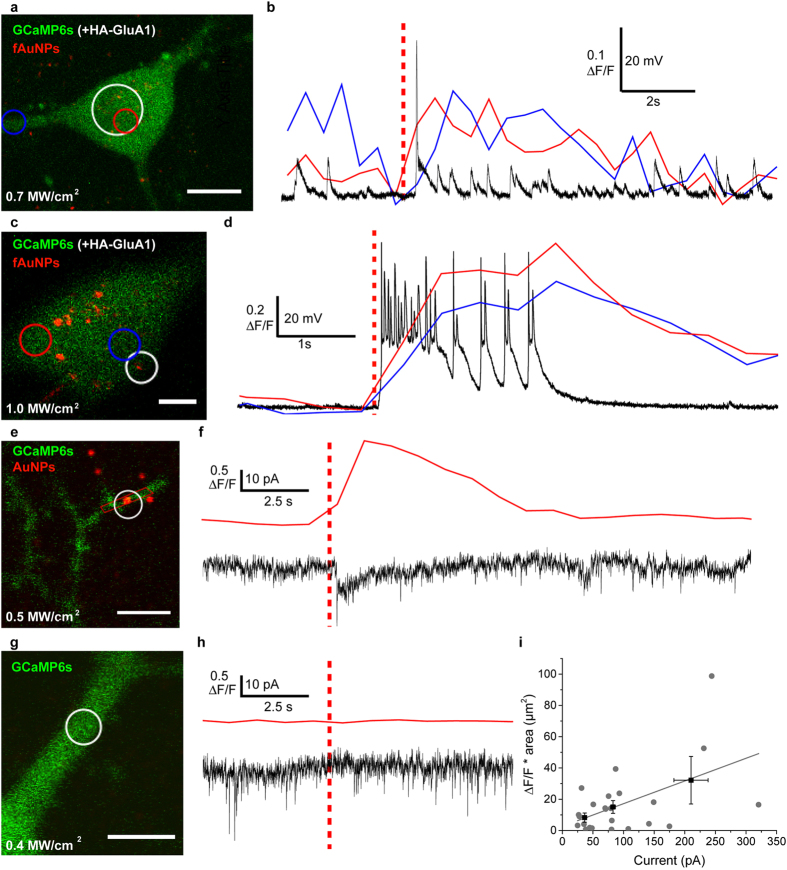
Figure 3. Optical and electrophysiological recording during NALOS.
(a,c,e,g) Representative neurons transfected as in Fig. 2, and imaged after pre-incubation with AuNPs (e, or not: g) or fAuNPs (a,c), and simultaneously patch-clamped under whole-cell current clamp (8 neurons, 2 independent cultures) (b,d) or voltage clamp configurations (f: 24 ROIs, 11 neurons, 5 independent cultures; h: 32 ROIs, 6 neurons, 2 cultures). (b,d) Ca2+ signal (ΔF/F) of the blue and red regions marked in (a,c) and voltage fluctuations over the same time (black trace). At lower stimulation intensity (0.7 MW/cm2) (a,b), NALOS induced a single AP (distinct from spontaneous synaptic events in that neuron) while higher stimulation intensity (1.0 MW/cm2) induced a burst of APs (c,d). (f) Top trace: Ca2+ transient evoked by NALOS and measured in the dendritic region marked in red in (e); bottom trace: spontaneous miniature synaptic currents (in TTX). Note the larger current evoked by the NIR fs laser stimulus. (h) Top trace: in absence of AuNP, no Ca2+ transient (measured in the stimulation ROI [white circles in g]) was evoked by the NIR fs laser, bottom trace: no current was evoked by NALOS in absence of AuNP (in all 32 ROIs from 6 neurons tested). (i) Correlation between the measured Ca2+ and electrophysiological response. The measured ΔF/F was multiplied by the dendritic area for which a fluorescence increase above noise threshold (twice the standard deviation of the baseline) was observed. The observed Ca2+ response was generally higher for stronger evoked depolarization. Black squares represent the averaged (±SEM) responses for 3 grouped electrophysiological responses (25-50 pA, 50–110 pA, 110–320 pA). A linear fit of the data is shown in grey (slope 0.15 ± 0.05, Pearson’s R = 0.51) (24 ROIs, 11 neurons, 5 independent cultures). The red dashed lines shown in (b,d,f,h) indicate the time point of laser stimulation. Stimulated area is indicated with a white circle in (a,c,e,g). Scale bars (a) 10 μm (c,e,g) 5 μm. Power range for e-i: 0.16–0.57 MW/cm2.

