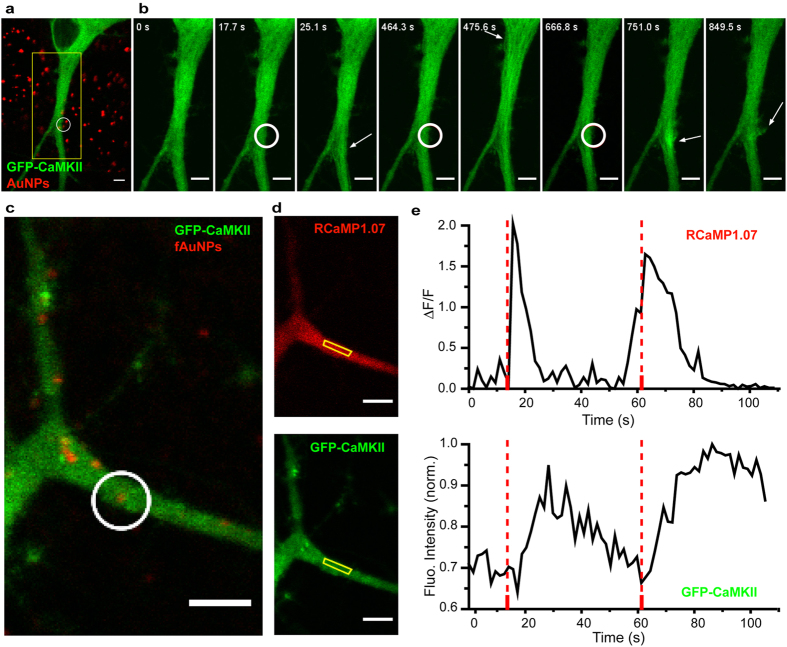
Figure 4. CaMKII translocation to local dendritic domains stimulated by NALOS.
(a) Fluorescence of GFP-CaMKII (green) and reflectance of the AuNPs (red) before stimulation. (b) Magnification of the region marked in (a) for 8 different time points. The white circle shows the region of NALOS and the white arrows mark the region where GFP-CaMKII translocation was observed. Representative example of 18 neurons. (c,d) Neuron co-transfected with GFP-CaMKII and RCaMP1.07. (c) Fluorescence of GFP-CaMKII and reflectance of the fAuNPs before stimulation. (d) Fluorescence of RCaMP1.07 (top) and GFP-CaMKII (bottom) 1.5 s after the first stimulation. (e) Top trace: Ca2+ levels measured in the yellow region marked in (d); bottom trace: Intensity of GFP-CaMKII in the same region. Representative example of 6 neurons. Note the spontaneous Ca2+ transient that precedes the 2nd stimulus, triggering a longer lasting Ca2+ event and CaMKII response. White circle in (c) shows the region of photo-stimulation at the time points marked with dotted lines in (e). Scale bars 5 μm.

