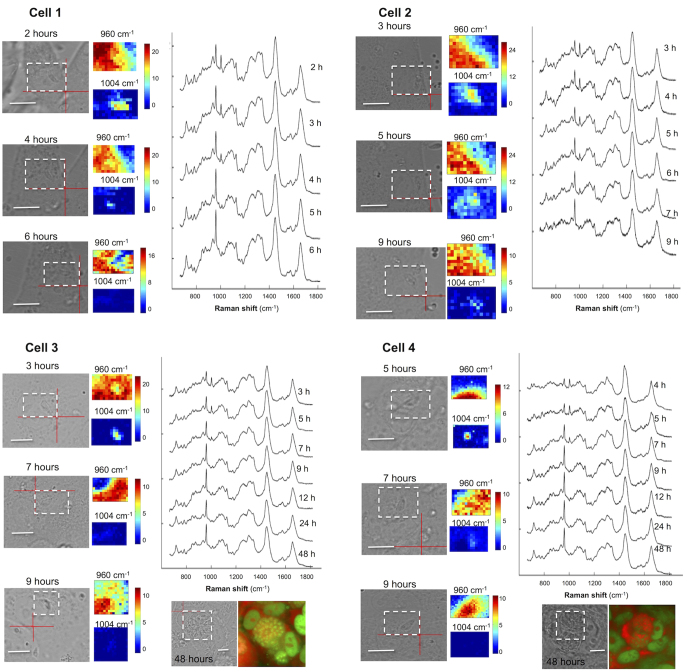
Figure 5. Typical time-course Raman spectra and maps corresponding to the 1004 cm−1 (l-Phe) and 960 cm−1 (l-Phe(D8)) bands of live T. gondii infecting ARPE-1 cells.
The measured areas are indicated by the white dashed rectangles. Acridine orange (AO) staining was carried out at 48 h after infection. All spectra are shifted vertically for clarity. Scale bars: 10 μm.

