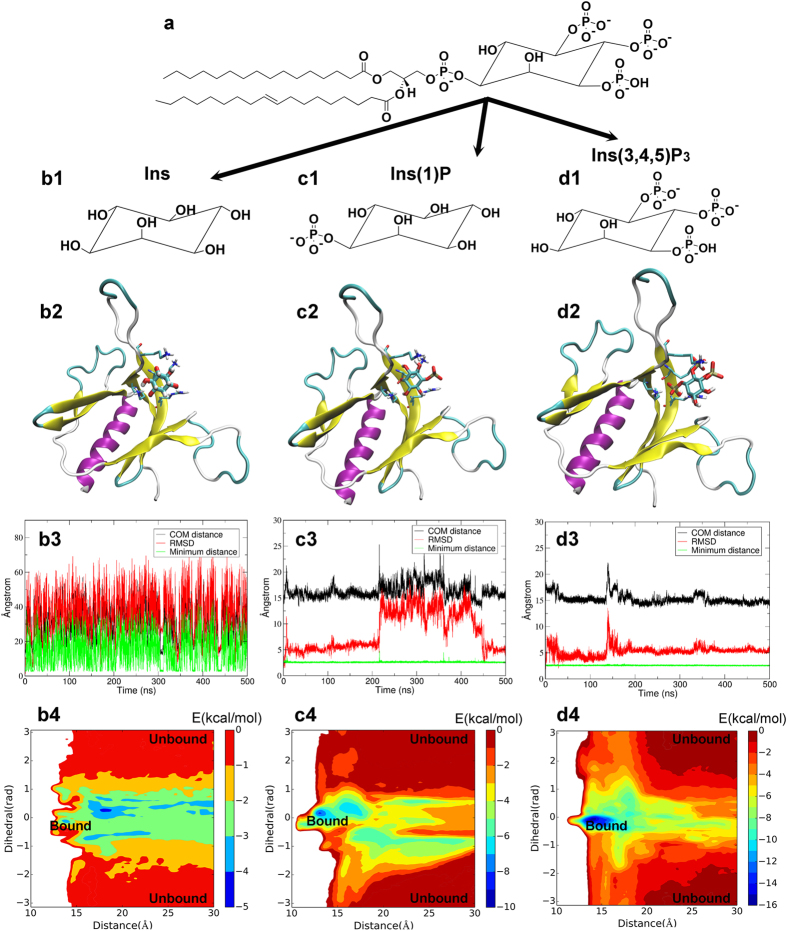
Figure 5. The binding profiles of Ins (b1-b4), Ins (1) P (c1-c4) and Ins (3,4,5) P3 (d1-d4) with SmCesA2-PH.
b1, c1 and d1 are the structures of Ins, Ins (1) P and Ins (3,4,5) P3, respectively. b2, c2 and d2 show the binding modes of the head groups with SmCesA2-PH. b3, c3 and d3 are some MD plots of the head groups used to monitor their binding processes with SmCesA2-PH. COM distance is the distance between the centers of mass (COMs) of the head group and the protein. RMSD is the root mean square deviation of the head group conformation in MD simulation after alignment of the protein. Minimum distance is the minimum distance between the head group and protein heavy atoms. b4, c4 and d4 are the free energy surfaces of the head groups on the surface of SmCesA2-PH obtained by metadynamics.

