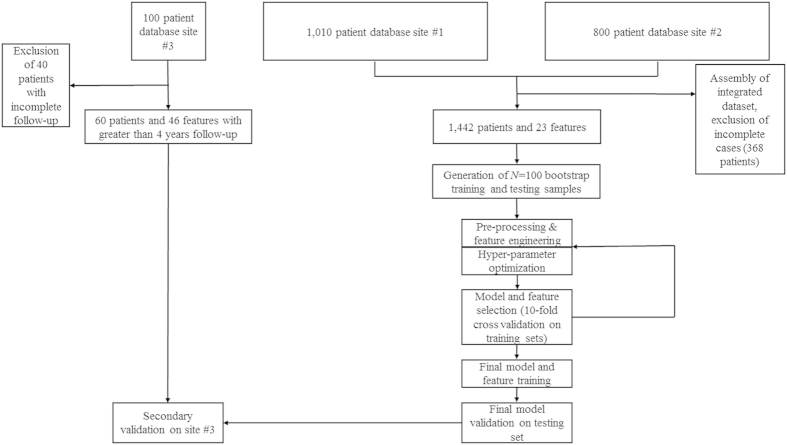
Figure 1. Flow chart of data assembly, processing, and analysis.
Patients were gathered from two independently maintained, prospective AVM radiosurgery databases. Both databases were integrated into a single dataset of 1,810 patients described by 23 features. The features were divided into an arbitrary number of bootstrap training and testing samples (N = 100). After data pre-processing including standardization and normalization, an iterative process of feature engineering, feature selection, predictor generation and assessment was instituted. After a satisfactory set of features was selected, a hyperparameter optimization routine was utilized, and four final predictors were trained and cross-validated on the dataset. The predictors included a logistic regression model, a random forests model, a stochastic gradient descent model, and a support vector machine model. Existing clinical models of AVM outcomes were also tested on the dataset, including the Spetzler-Martin scale (SM), modified Radiosurgery Based AVM Score (RBAS), and Virginia Radiosurgery AVM Scale (VRAS).

