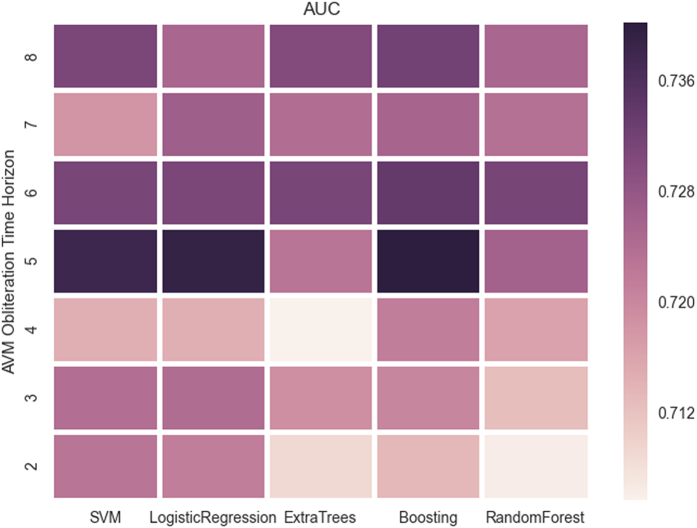
Figure 3. A heatmap of AUC for the different classifiers across various times points.
There is a trend towards peak performance at five years for all classifiers, with a skew towards superior performance at later time points. The increased accuracy at later time points is likely due to the more evenly balanced data due to more patients having met the endpoint by later time points.

