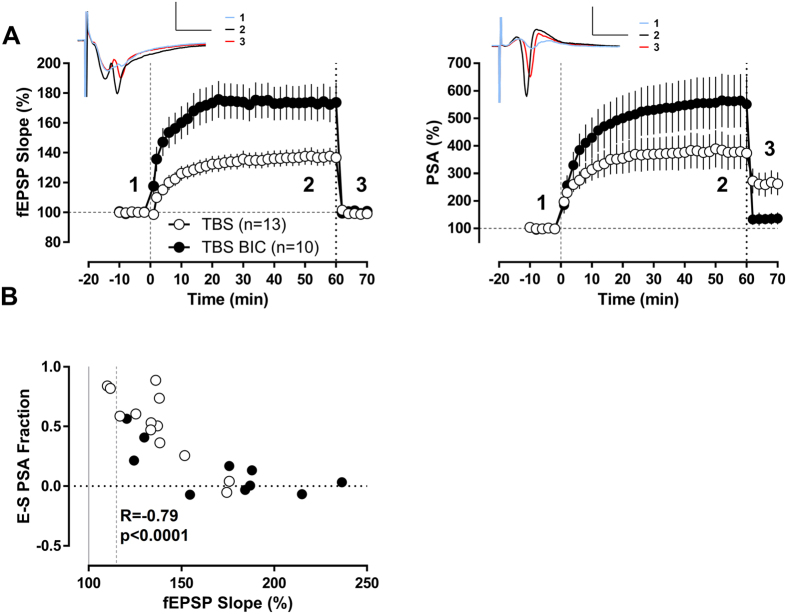
Figure 1. Excitability changes are inversely related to synaptic potentiation in the granule cell population after TBS conditioning protocol.
(A) Temporal course of population spike amplitude (PSA) and fEPSP-slope. PSA and fEPSP values were normalized for every slice by its pre-conditioning protocol baseline. TBS protocol was applied at time “0” with intact GABAergic inhibition (TBS n = 13) or under bicuculline (TBS BIC n = 10). One hour after TBS protocol, the test stimulation intensity was reduced to match the baseline fEPSP-slope values. The remaining PSA potentiation displays the excitability changes non-explained by the synaptic potentiation. Insets show traces corresponding to the TBS group at the indicated time points: 1- at baseline, 2−1 h after TBS and 3- after reducing stimulation intensity to match baseline fEPSP-slope. Scale bars: 2 mV/5 ms. (B) Scatter plot of the fraction of the total PSA potentiation that is not explained by the synaptic LTP (the remaining population spike potentiation after reducing stimulation intensity to match baseline fEPSP-slope was normalized in every slice to the spike potentiation averaged in the last 4 min previous to the stimulation intensity reduction) and the fEPSP-slope potentiation at 1 hour after TBS for every experiment. There was a significant negative correlation between both variables when GABAergic inhibition was intact (R = −0.86, p < 0.0001, Pearson) as well as in the presence of bicuculline (R = −0.71, p < 0.05, Pearson). When both conditions were analyzed together as a whole group the correlation was still highly significant (R = −0.78, p < 0.0001, Pearson).

