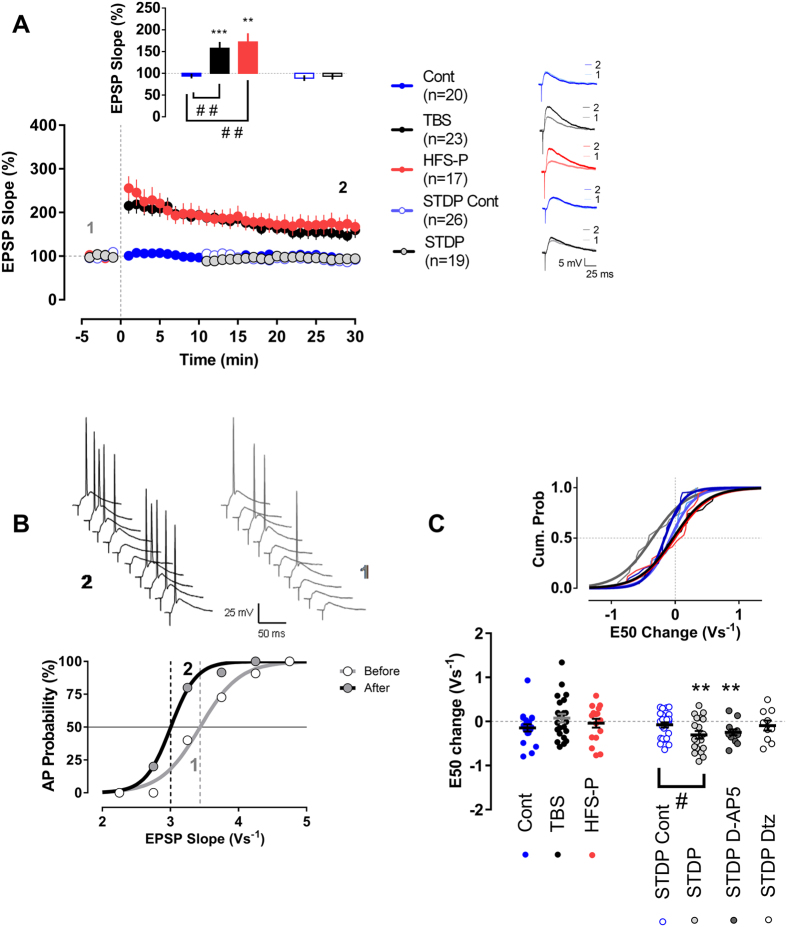
Figure 2. Dissociation between synaptic and excitability plasticity in mature granule cells.
(A) Synaptic changes induced by the three conditioning protocols (TBS n = 23, HFS-P n = 17 and STDP n = 19) and their respective control groups (Cont n = 20 and STDP-Cont n = 26). EPSP-slope values were normalized for every cell by its pre-conditioning protocol baseline. The insets show the EPSP-slope potentiation in the last 4 min of recordings and representative EPSP traces for the groups. TBS and HFS-P groups showed a significant synaptic potentiation, whereas in the other experimental groups the EPSP-slope remained around baseline values. (B) Example of an E-S curve, plotting of the firing probability versus EPSP-slope, for a cell in the STDP group. (C) E-S shift. Two E-S curves were generated for every cell before and after (30–45 min) the conditioning protocol. A significant E50 shift in the E-S relation was only present in the STDP group and not in TBS or HFS-P group. This STDP E50 change did not reached statistical significance in the presence of the L-type channel blocker diltiazem (Dtz, n = 10), but was highly significant in the presence of the NMDA receptor antagonist D-AP5 (n = 13). The inset displays the cumulative probability curves for the E50 shifts in Cont, TBS, HFS-P and STDP groups. All recordings were made in the presence of bicuculline. **,***p < 0.01 and p < 0.001, paired t-test. #p < 0.05, t-test. ##p < 0.01, Bonferroni post-hoc test after one-Way ANOVA.

