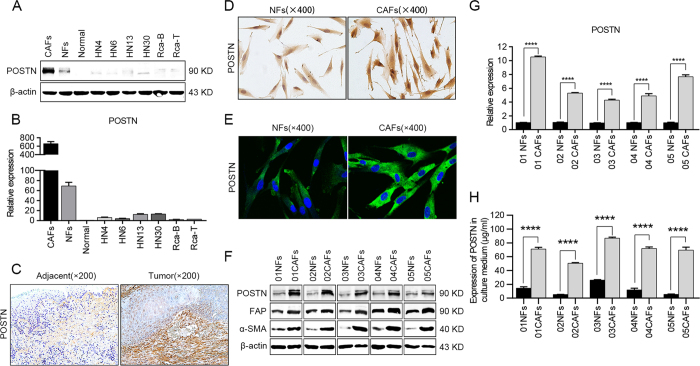
Figure 2. CAFs contributed to the overexpression of POSTN in HNC tissues.
(A,B) The transcriptional and translational statuses of POSTN were determined in CAFs and NFs, 6 representative HNC cell lines and normal oral epithelial cells (titled normal) using western blotting (A) and real-time PCR (B). (C) Representative images of immunohistochemical staining showed the distribution of POSTN expression in adjacent normal tissues and HNC tissues. (D,E) POSTN expressions in NFs and CAFs were detected using immunohistochemical staining (D) and confocal microscopy (E). (F) The protein levels of POSTN, FAP and α-SMA were determined by a western blot analysis. (G) POSTN mRNA levels in 5 pairs of NFs and CAFs were measured by real-time PCR. (H) POSTN protein levels in the media of NFs and CAFs were determined by ELISA analyses. (****p < 0.0001).

