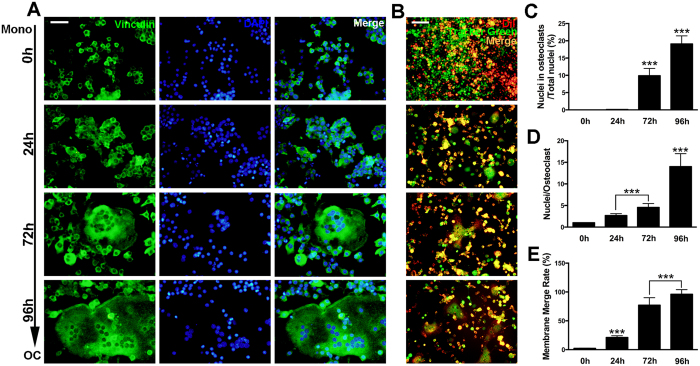
Figure 2. Osteoclasts formation and fusion at different stages.
(A) Representative images of FAK stain of osteoclasts cultured from RAW264.7 cells induced with RANKL (100 ng/mL) and M-CSF (50 ng/mL) for 0 h, 24 h, 72 h and 96 h. The scale bar represents 100 μm. (B) Representative images of fusion assay. Cells were induced with RANKL (100 ng/mL) and M-CSF (50 ng/mL) for 0 h, 24 h, 72 h and 96 h. The scale bar represents 100 μm. (C) Quantification of the total number of nuclei in osteoclasts over the total number of nuclei. (D) Average nuclei number of osteoclasts of FAK stain at different stages. (E) Membrane merge rate of osteoclasts from fusion assay at each differentiation stage. The data in the figures represent the averages ± SD. *p < 0.05, **p < 0.01, and ***p < 0.001 based on one-way ANOVA.

