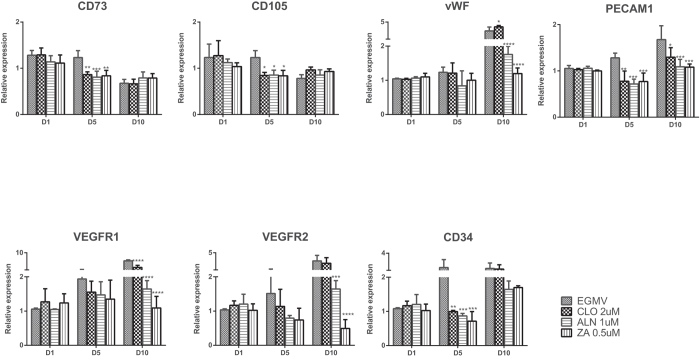
Figure 9. Relative gene expression of stem (CD73 and CD105) and endothelial (von Willebrand Factor, PECAM-1, VEGF-R1, VEGF-R2, and CD34) cell markers in pMSCs after 1, 5 and 10 days differentiation in EGMV alone or with the BPs CLO (2 μM), ALN (1 μM) or ZA (0.5 μM).
Significant differences in expression compared to EGMV are indicated as *p < 0.05, **p < 0.01, ***p < 0.005 and ****p < 0.0001.

