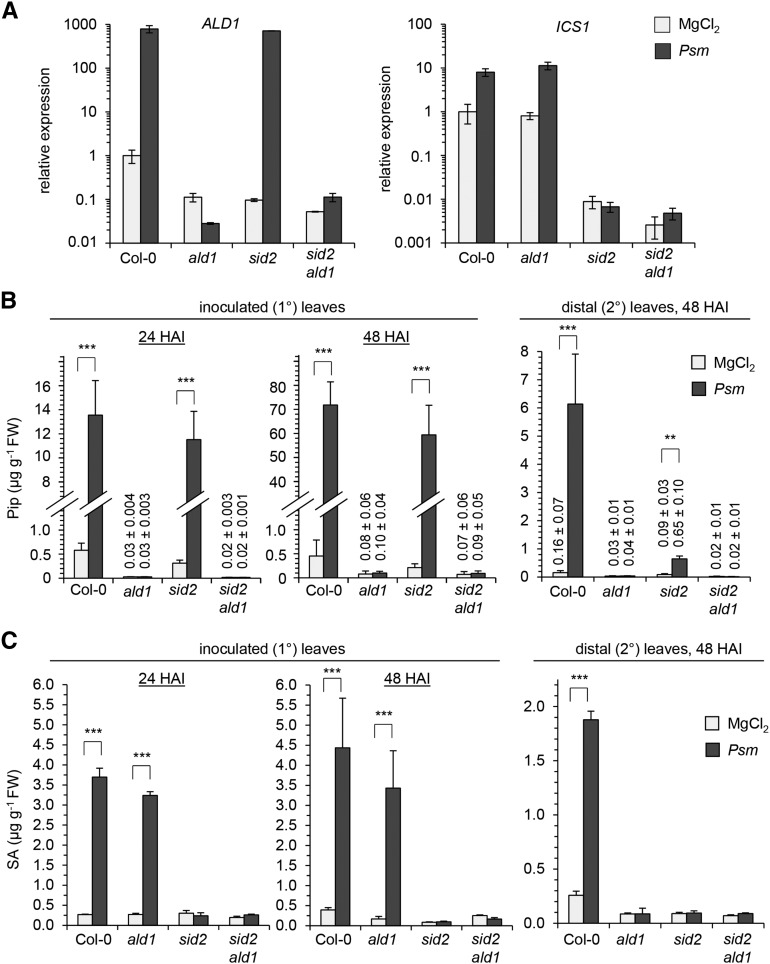
Figure 1.
Pip and SA Biosynthesis in Local and Systemic Tissue of Wild-Type Col-0, ald1, sid2, and sid2 ald1 Plants Inoculated with SAR-Inducing Psm.
(A) Expression of ALD1 (left) and ICS1 (right) in Psm-inoculated leaves at 24 h after inoculation (HAI). Infiltration with 10 mM MgCl2 served as a mock control treatment. Transcript levels were assessed by qPCR analysis and expressed relative to the Col-0 mock control value. Data represent the mean ± sd of three biological replicate leaf samples from different plants. Each biological replicate consists of two leaves from one plant. Expression values for each biological replicate represent the mean of two technical replicates.
(B) and (C) Accumulation of Pip (B) and free SA (C) in Psm-inoculated (1°) leaves at 24 and 48 HAI (left) and in distal, noninoculated (2°) leaves (right) at 48 HAI. Data represent the mean ± sd of at least three biological replicate leaf samples from different plants. Each biological replicate consists of six leaves from two plants. Asterisks denote statistically significant differences between Psm and MgCl2 samples (***P < 0.001 and **P < 0.01; two-tailed t test). Numerical values for samples with very low metabolite contents are given above the respective bars.

