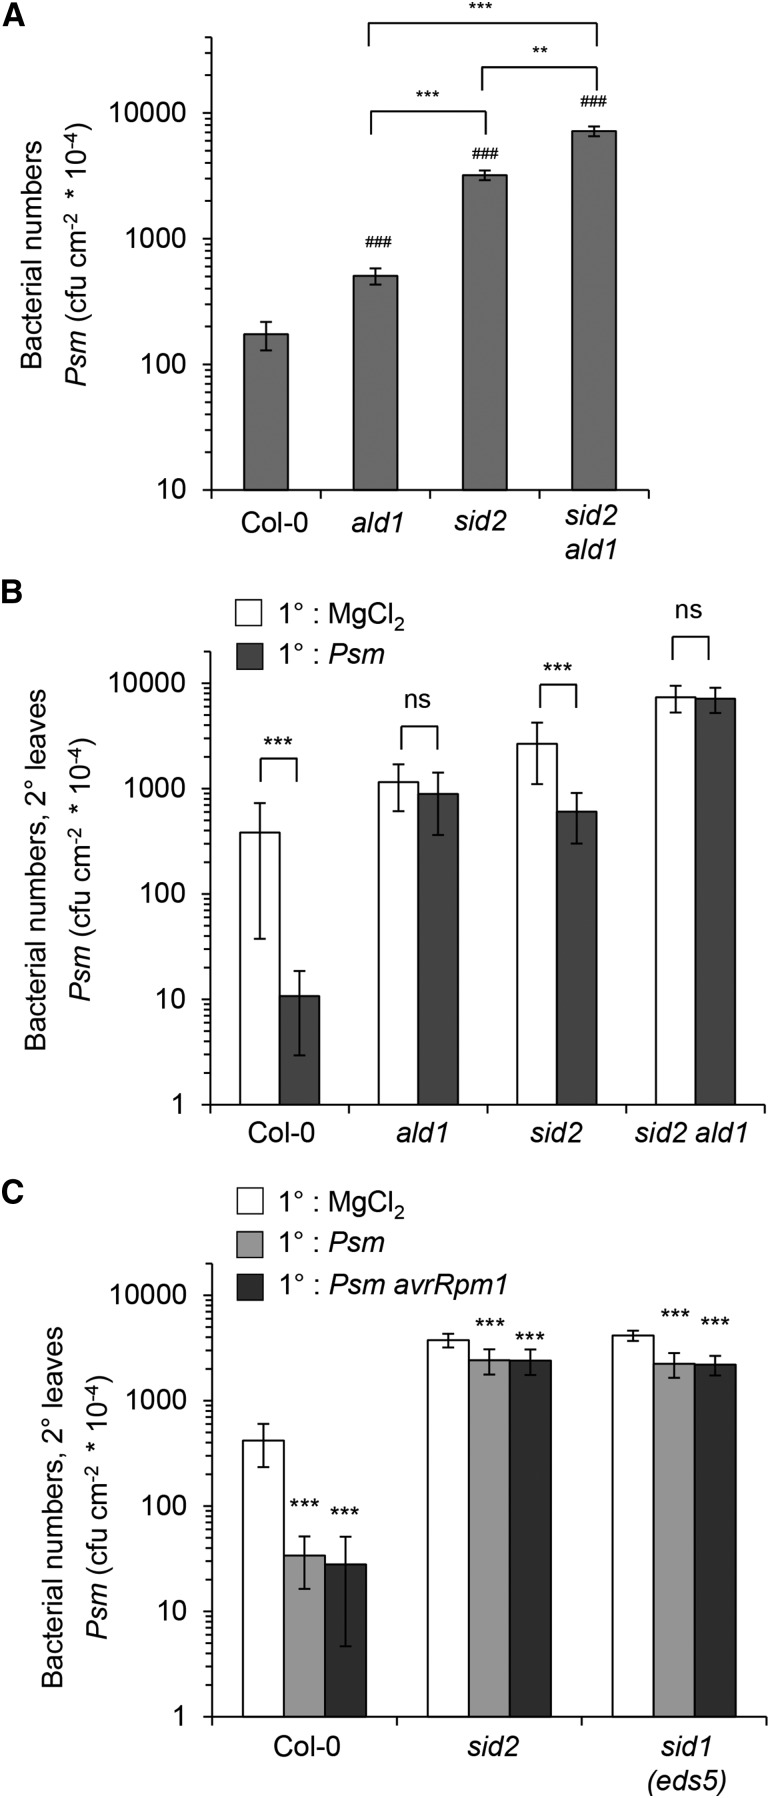
Figure 2.
Analyses of Basal Resistance to Psm and SAR in Pip- and/or SA-Deficient Mutant Plants.
(A) Basal resistance of Col-0, ald1, sid2, and sid2 ald1 plants to Psm. Three leaves per plant were inoculated with a suspension of Psm (OD600 = 0.001) and bacterial numbers quantified 3 d later. Bars represent mean values (±sd) of colony-forming units (cfu) per square centimeter from at least seven biological replicate samples (n) derived from different plants. Each biological replicate consists of three leaf discs harvested from different leaves of one plant. Number signs denote statistically significant differences from the Col-0 wild-type value (#P < 0.05, ##P < 0.01, and ###P < 0.001; two-tailed t test). Asterisks designate statistically significant differences between indicated samples. To test whether the effects of ald1 and sid2 on bacterial proliferation are additive or synergistic, a linear model was used (log10 bacterial count ∼ ald1*sid2). No significant interaction of ald1*sid2 was detected both according to the F-test and according to Akaikes information criterion (P = 0.0508, AICsynergistic = −120 AICadditive = −122.7); hence, the effect is additive.
(B) SAR assay with Col-0, ald1, sid2, and sid2 ald1 plants. Lower (1°) leaves were infiltrated with either 10 mM MgCl2 or Psm (OD600 = 0.005) to induce SAR, and 2 d later, three upper leaves (2°) were challenge-infected with Psm (OD600 = 0.001). Bacterial growth in upper leaves was assessed 3 d after 2° leaf inoculation (n ≥ 7; as described in [A]). Asterisks denote statistically significant differences between Psm pretreated and mock control samples (***P < 0.001; ns, not significant, two-tailed t test).
(C) Biological SAR induction upon 1° leaf inoculation with compatible Psm and incompatible Psm avrRpm1 in Col-0, sid2, and sid1 plants (n ≥ 7; as described in [A] and [B]). Asterisks denote statistically significant differences between Psm or Psm avrRpm1 (OD600 = 0.005) pretreated and mock control samples (***P < 0.001; two-tailed t test).

