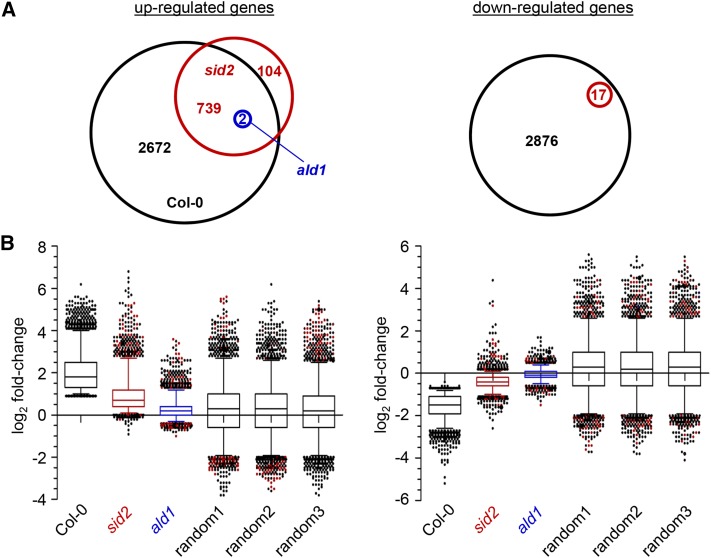
Figure 3.
Transcriptional SAR Response in Distal Leaves of Plants Inoculated in Primary Leaves with Psm (OD600 = 0.005) at 48 HAI.
Six independent SAR assays for Col-0 and three independent SAR experiments for both sid2 and ald1 were performed. Gene expression was analyzed by RNA-seq analyses of the resulting replicate samples for Psm and mock treatments at the whole-genome level.
(A) Venn diagram depicting numbers of differentially regulated genes between Psm and mock treatments of Col-0 (black), sid2 (red), and ald1 (blue) (FDR < 0.01). Overlap of genes is indicated. Left: significantly upregulated genes (the Col-0 genes correspond to the SAR+ genes). Right: significantly downregulated genes (the Col-0 genes correspond to the SAR− genes). Note that only two genes are differentially regulated in ald1.
(B) Distribution of P/M-fold changes of SAR genes in Col-0, sid2, and ald1. Box plots depict log2-transformed P/M-fold changes. The distribution of log2 P/M-fold changes for three sets of randomly selected genes (left, 3413 genes; right, 2893 genes) is included (random a, b, and c). Left, SAR+ genes; right, SAR− genes.

