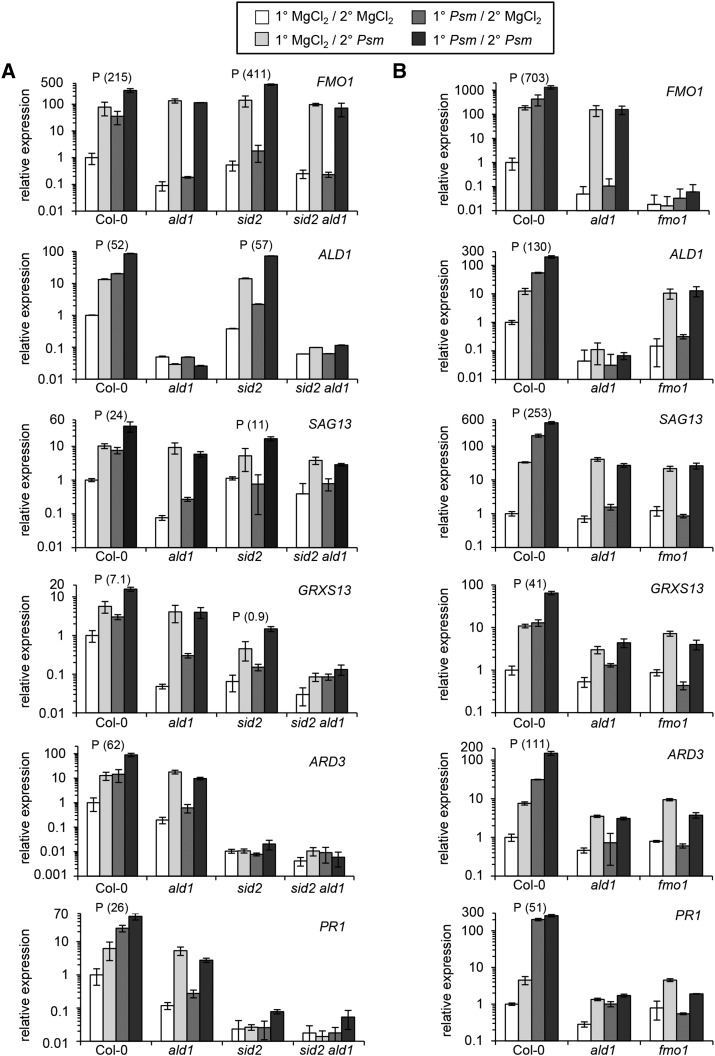
Figure 6.
SAR-Associated Priming of Defense-Related Gene Expression Fully Depends on a Functional Pip/FMO1 Module but Is Only Partially SA Dependent.
(A) SAR priming assays for Col-0, ald1, sid2, and sid2 ald1 plants.
(B) SAR priming assays for Col-0, ald1, and fmo1 plants (independent experiment).
The priming assay consisted of an inductive Psm inoculation or mock (MgCl2) treatment of 1° leaves, followed by a Psm challenge or mock treatment of 2° leaves 48 h later. Gene expression in 2° leaves was assessed 10 h after the second treatment (Supplemental Figure 9A). A particular defense response was defined as primed if the differences between the (1°-Psm/2°-Psm) and the (1°-Psm/2°-MgCl2) values were significantly larger than the differences between the (1°-MgCl2/2°-Psm) and the (1°-MgCl2/2°-MgCl2) values (two-sided Mann-Whitney U test, α = 0.005) (Supplemental Figure 9B). A P above the bars for a particular genotype indicates priming. Expression of three partially SA-independent SAR+ genes (FMO1, ALD1, and SAG13; Table 1) and three SA-dependent SAR+ genes (GRXS13, ARD3, and PR1) were monitored. Transcript levels were assessed by quantitative real-time PCR analysis and are given as means ± sd of three biological replicates. Each biological replicate involves two technical replicates. The transcript levels are expressed relative to the respective Col-0 mock control value. Note that the graphs use a base 10 logarithmic scale for the y axes to ensure recognizability of both high and low values. Graphs with a linear scale for the y axes, which more clearly illustrate differences between challenge-infected 1° mock-treated and 1° Psm-induced plants, are depicted in Supplemental Figure 10. As a measure of the gain of a response due to priming, we calculated the prgain (response gain due to priming) for each genotype with activated priming according to the formula given in Supplemental Figure 9C. prgain values are given in parentheses behind the priming indicator P and allow estimates about quantitative differences of the strength of priming between genotypes. The higher the prgain value, the stronger the priming. The data sets depicted in (A) and (B) are derived from independent experiments.

