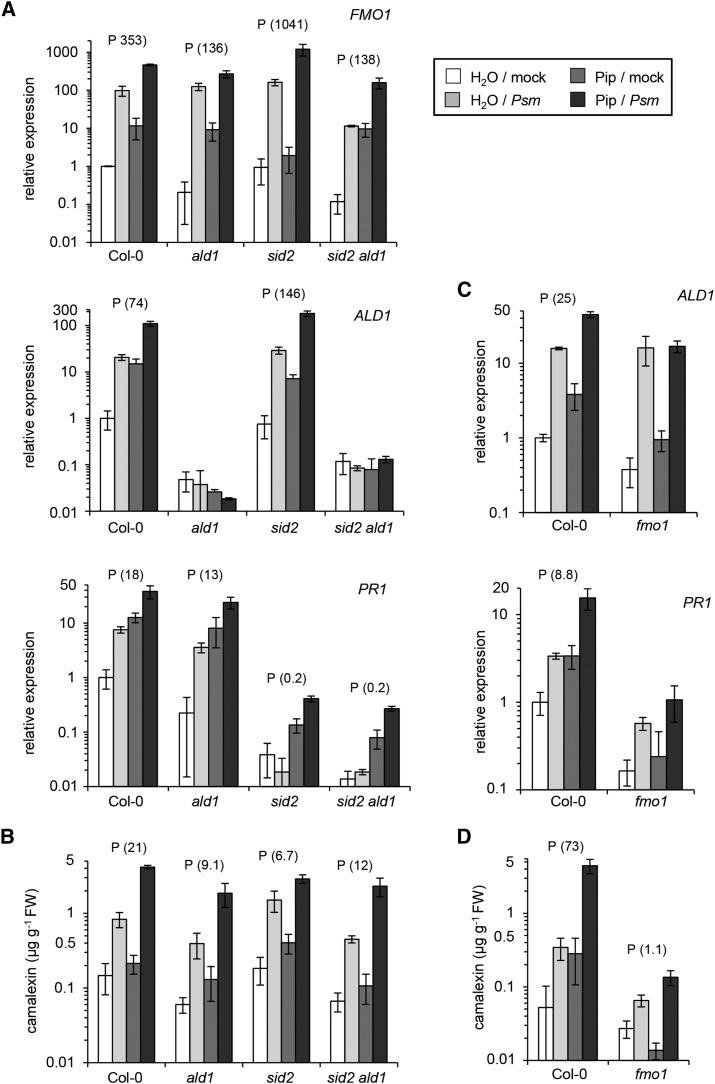
Figure 8.
Exogenous Pip Confers Defense Priming in a FMO1-Dependent and Partially SA-Independent Manner.
(A) Pip-induced priming of gene expression (FMO1, ALD1, and PR1) in Col-0, ald1, sid2, and sid2 ald1 plants, as determined by qPCR analysis. Plants were supplied with 10 mL of 1 mM Pip (≡ dose of 10 µmol) or with 10 mL of water (control treatment) via the root system and leaves challenge-inoculated with Psm or mock-infiltrated 1 d later. Defense responses in leaves were determined 10 h after the challenge treatment. Values represent the mean ± sd of three biological replicates from different plants. Each biological replicate consists of two leaves from one plant and involves two technical replicates. A P above the bars for a particular genotype indicates defense priming in this genotype, as assessed in analogy to SAR priming. The prgain values are given in parentheses (see legend to Figure 6 and Supplemental Figure 9).
(B) Pip-induced priming for camalexin production in Col-0, ald1, sid2, and sid2 ald1 plants. Values represent the mean ± sd of three biological replicates from different plants. Each biological replicate consists of six leaves from two plants.
(C) Pip-induced priming assays in Col-0 and fmo1 plants, monitoring ALD1 and PR1 expression. Sampling as outlined in (A). The data sets depicted in (A) and (C) originate from independent experiments.
(D) Pip-induced priming assays in Col-0 and fmo1 plants, monitoring camalexin accumulation. Sampling is outlined in (B). The data sets depicted in (B) and (D) originate from independent experiments.
Note that the graphs use a logarithmic scale for the y axes. The same graphs with linear scaling are depicted in Supplemental Figure 12.

