Figure 2.
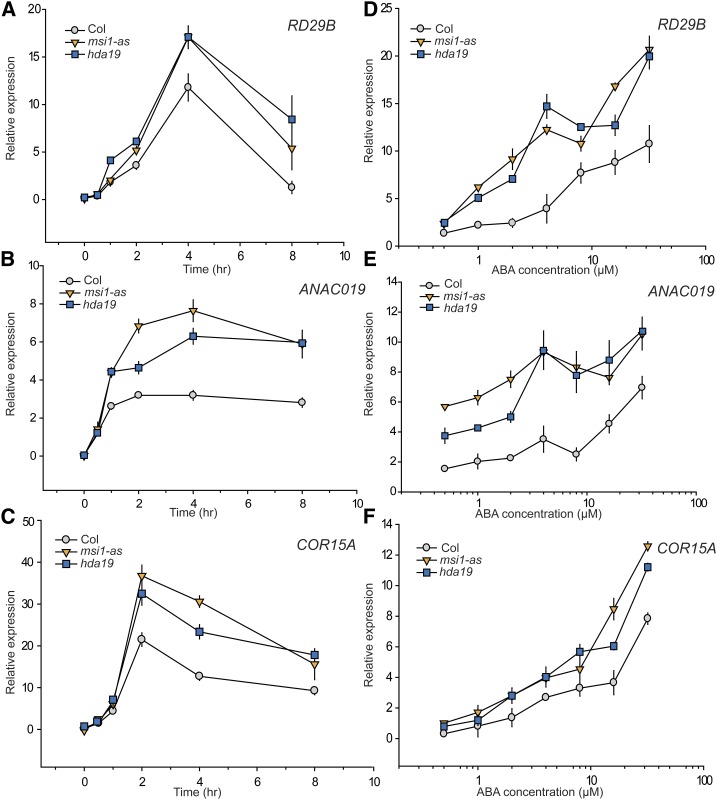
Both msi1-as and hda19 Mutants Show Upregulation of ABA-Responsive Genes over Time in an ABA Dose-Dependent Manner.
(A) to (C) Expression kinetics of RD29B, ANACO19, and COR15A. Relative change in expression over 8 h of RD29B, ANAC019, and COR15A in the wild type (gray circles), msi1-as (orange triangles), and hda19 (blue squares), respectively. Differences from the wild type are significant (two-sided t test, P ≤ 0.05) for all genes for time points at 3 h and longer and for ANAC019 also at 1 h.
(D) to (F) ABA dose dependency of RD29B, ANACO19, and COR15A expression. Relative change in expression of RD29B, ANAC019, and COR15A in the wild type (gray circles), msi1-as (orange triangles), and hda19 (blue squares), respectively, treated with different concentrations of ABA for 4 h. Differences from the wild type are significant (P ≤ 0.05) for RD29B above 0.5 µM ABA, for ANAC019 at all concentrations, and for COR15A above 10 µM ABA. Expression levels are relative to PP2A. Graphs show the mean ± se of three biological replicates.

