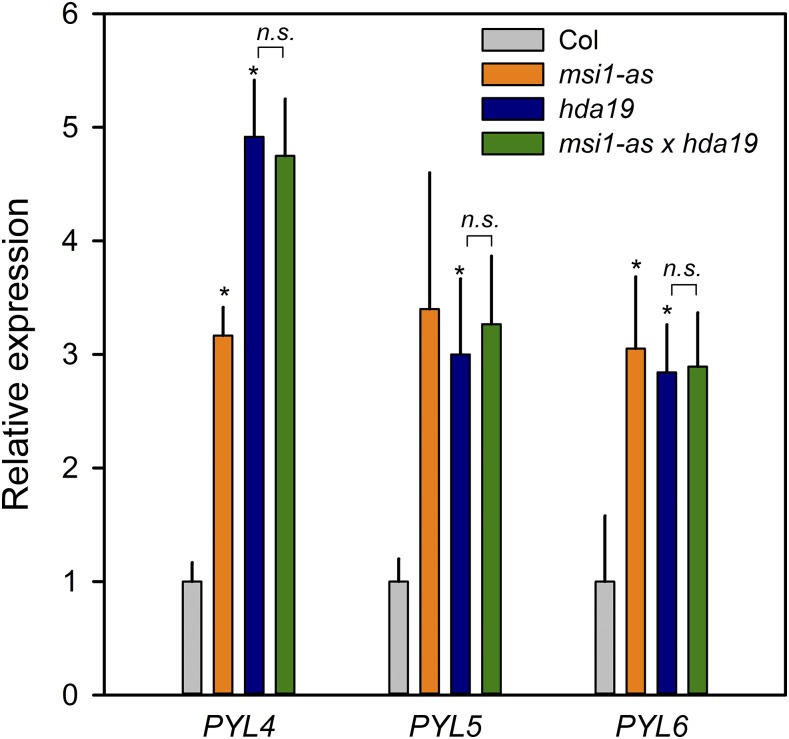
Figure 3.
Increased Transcript Levels of ABA Receptors in msi1-as and hda19.
Relative expression of PYL4, PYL5, and PYL6 in the wild type (gray), msi1-as (orange), hda19 (blue), and msi1-as hda19 (green). Expression levels are relative to PP2A and further normalized to the wild type. Graphs show the mean ± se of three biological replicates. Asterisks indicate values that are significantly larger (P ≤ 0.05) than in the wild type. n.s. indicates no significant difference between msi1-as hda19 and hda19.

