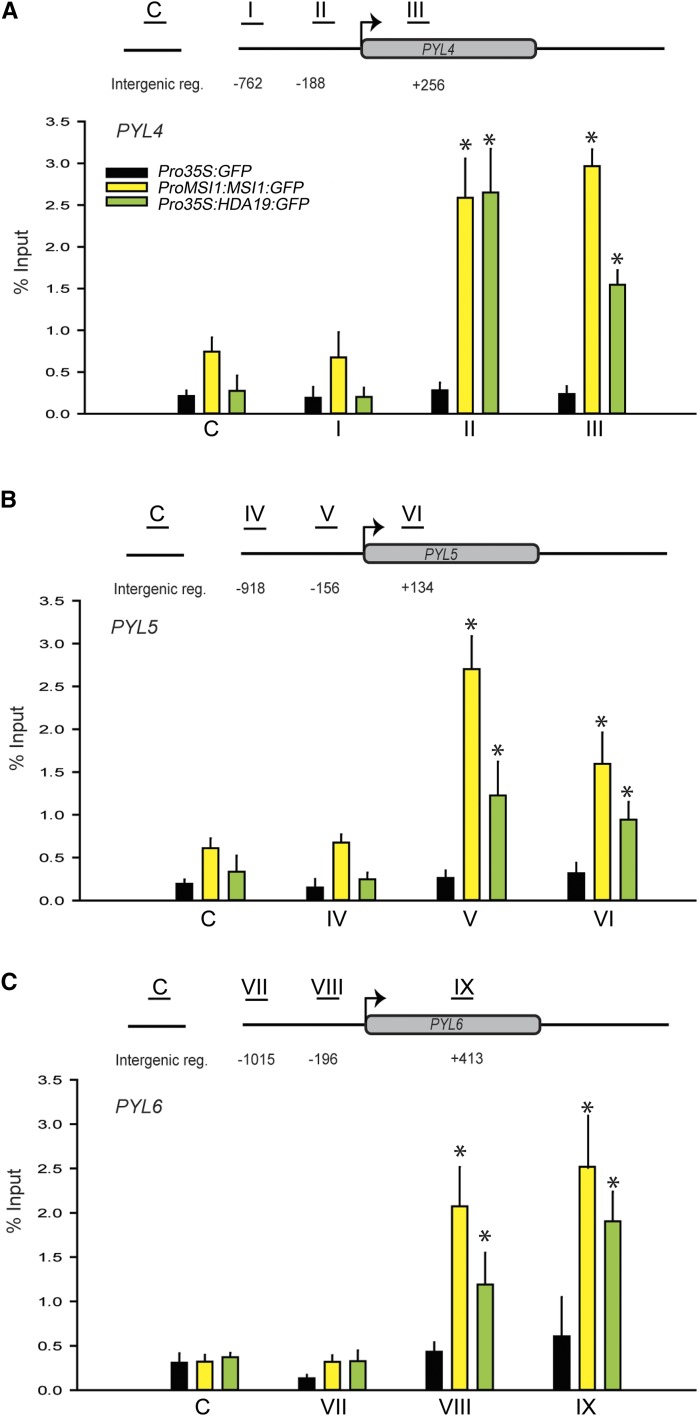
Figure 4.
MSI1 and HDA19 Bind to Chromatin at ABA Receptor Genes.
ChIP was performed using 14-d-old Pro35S:GFP, ProMSI1:MSI1:GFP, and Pro35S:HDA19:GFP plants and anti-GFP antibodies. The graphs show MSI1 (yellow) and HDA19 (green) recovery at PYL4, PYL5, and PYL6 compared with a Pro35S:GFP control (black). Schemes above the diagrams represent the recovery at PYL4 (A), PYL5 (B), and PYL6 (C) loci. Black lines with Roman numerals represent the regions probed by PCR. Results of IgG control ChIP assays were plotted separately (Supplemental Figure 2). Values are recovery as percent of input; shown are mean ± se of three biological replicates. Asterisks indicate significant (P ≤ 0.001) difference from Pro35S:GFP controls.

