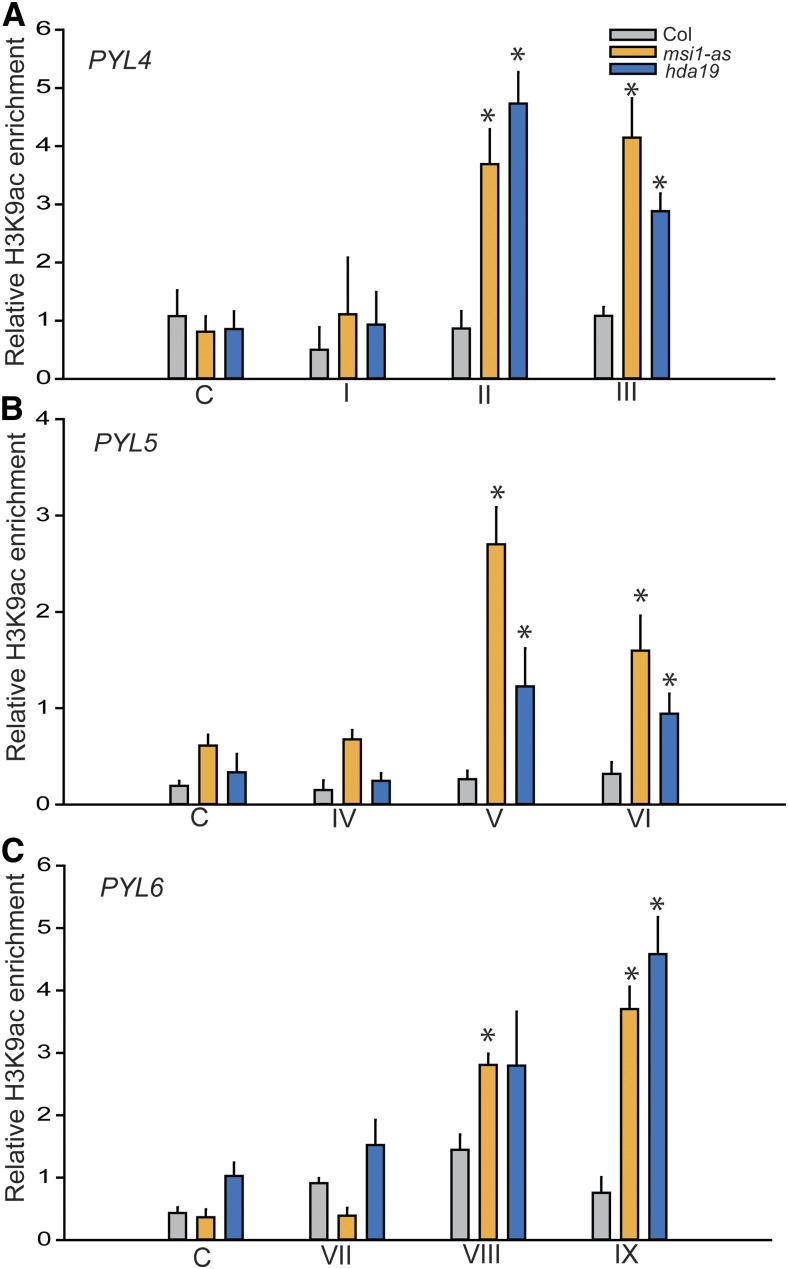
Figure 5.
MSI1 and HDA19 Affect the H3K9 Acetylation Status at ABA Receptor Genes.
The graphs show increased H3K9ac levels in msi1-as (orange) and hda19 (blue) compared with the wild type (gray) at the PYL4, PYL5, and PYL6 locus, respectively. Fragment labels below the graphs are as in Figure 4. Anti-H3K9ac ChIP-qPCR was performed using 14-d-old plants. Values represent recovery expressed as relative enrichment of H3K9ac compared with H3 levels. Results of IgG control ChIP assays were plotted separately (Supplemental Figure 3). Shown are means ± se of three biological replicates. Asterisks indicate significant (P ≤ 0.01) difference from the wild type.

