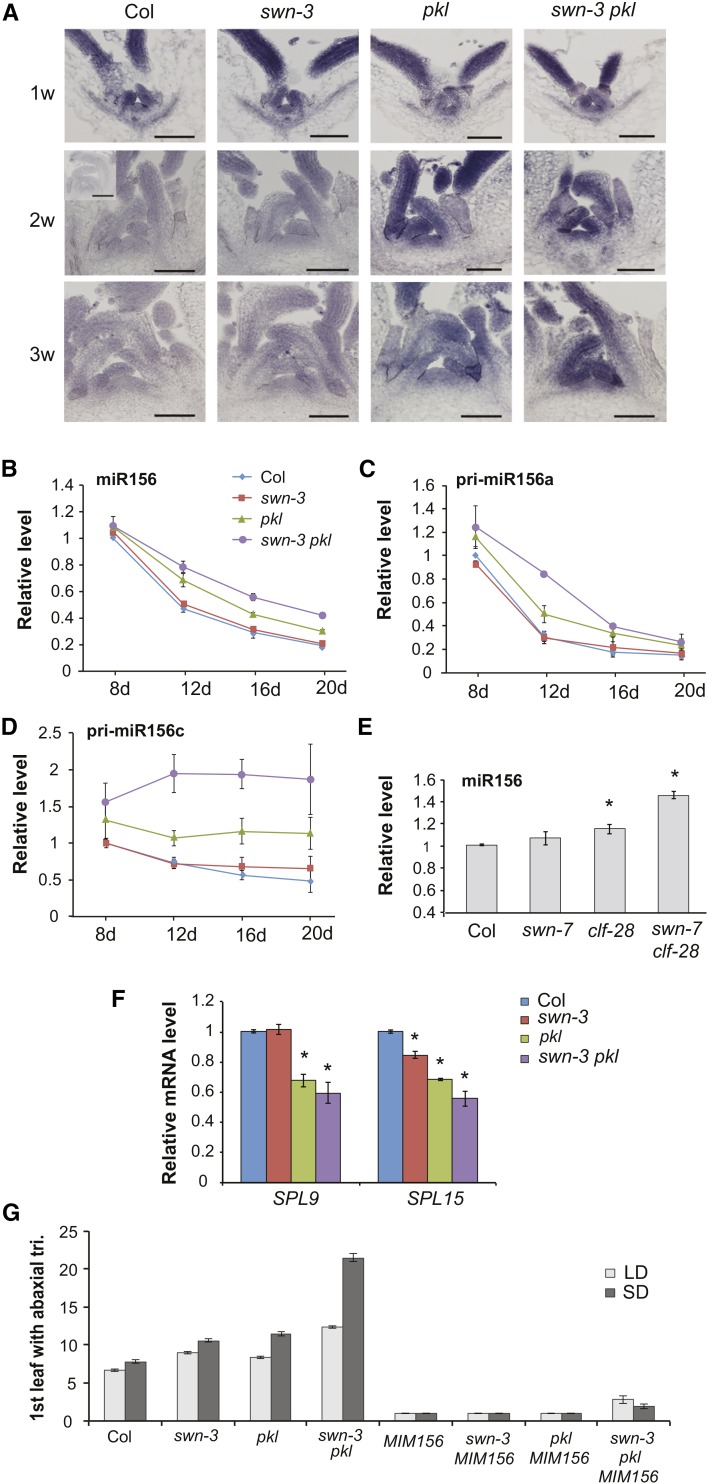
Figure 3.
PKL and SWN Promote Vegetative Phase Change by Repressing the Transcription of MIR156A and MIR156C.
(A) In situ localization of mature miR156 in the shoot apices of Col and mutant plants at 1, 2, and 3 weeks of development. The insert in the 2w Col panel shows hybridization to a mir156a miR156c double mutant (Yang et al., 2013), as a control for the background signal. Bars = 50 µm.
(B) to (D) RT-qPCR analysis of temporal variation in miR156 (B), pri-miR156a (C), and pri-miR156c (D) in the shoot apices of Col and mutant plants. miR156 decreases more slowly than normal in swn-3 pkl. Values are relative to Col at 8 d and represent the mean ± se from three biological replicates.
(E) RT-qPCR analysis of miR156 in 2-week-old Col and mutant plants. miR156 is significantly elevated in clf-28 (*P < 0.05) and swn-7 clf-28 (*P < 0.01, Student’s t test). Values are relative to Col and represent the mean ± se from three biological replicates.
(F) RT-qPCR analysis of SPL9 and SPL15 transcripts in 20-d-old Col and mutant plants. SPL9 is significantly reduced in pkl and swn-3 pkl, and SPL15 is significantly reduced in all three genotypes (*P < 0.05, Student’s t test). Values are relative to Col and represent the mean ± se from two biological replicates.
(G) First leaf with abaxial trichomes in Col, mutant, and 35S:MIM156 transgenic plants. 35S:MIM156 suppresses the phenotype of swn-3, pkl, and swn-3 pkl. n = 19 to 24 for each genotype.

