Figure 6.
Ratiometric Analysis of Mitochondrial roGFP2 Fluorescence Reveals Enhanced Matrix Oxidation in Bgh-Infected Cells.
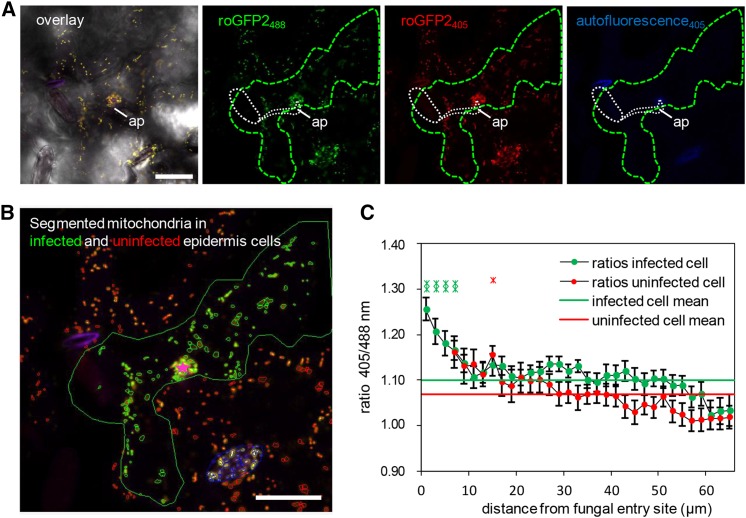
(A) and (B) Representative single frames of a typical CLSM time lapse (Supplemental Movie 3) of transgenic mt-roGFP2 in epidermal cells infected by Bgh (green outline) and uninfected neighboring epidermal cells that show an accumulation of roGFP2-expressing mitochondria below the fungal appressorium (ap; white dashed line). In (A), an overlay image of bright-field mt-roGFP2 fluorescence with excitation at 405 nm (red) and 488 nm (green) and autofluorescence (blue), as well as the respective single-channel images, are shown. Germinated fungal structures including the appressorium (ap) are indicated by white dashed line. Ratiometric analysis was performed on segmented mitochondria in infected (green) and uninfected (red) cells, and their distance was measured relative to the attempted penetration site (pink star) (B). Mitochondria localized in stomata (blue outlines) were excluded from the analysis presented in (C). Bars = 25 µm.
(C) Plot of the mt-roGFP2 fluorescence intensity ratio indicates higher 405/488-nm ratios and, therefore, higher oxidative state of mitochondria in Bgh-infected cells, especially close to the attempted penetration site. Data points represent average (±se) 405/488-nm ratios of each mitochondria present in concentric 2-µm annuli centered on the attempted penetration site and measured over a time frame of 01:26 min (34 frames) for 24 individual penetration events (i.e., a total number of 816 analyzed frames). Additionally, whole-cell 405/488-nm ratios were averaged and indicated for infected (green line) and uninfected (red line) cells.

