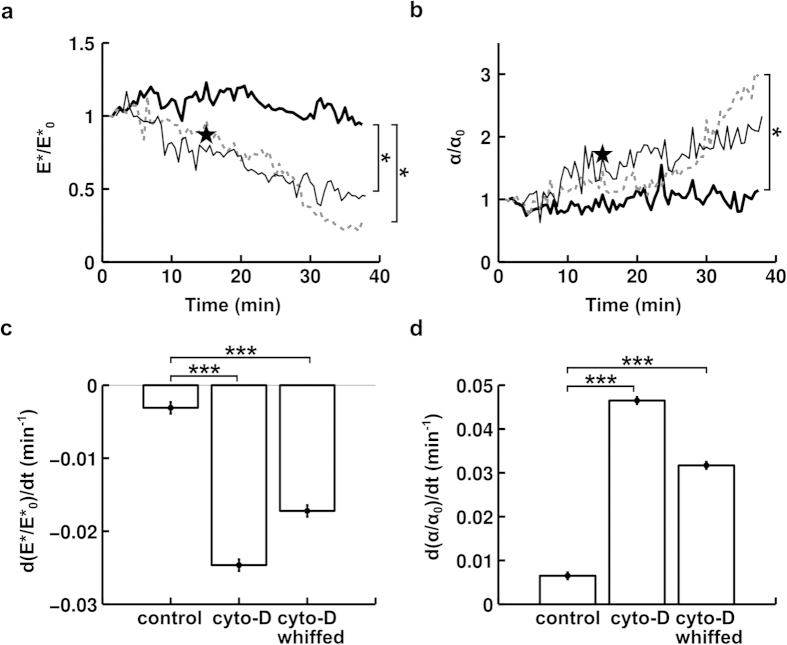
Figure 7. Impact of cytochalasin-D on BAEC mechanical properties.
(a) Time evolution of BAEC apparent stiffness E*. E* is normalized by its value at t = 0 min E*0. The indentation speed is 1.4 μm/s. Thick black line is control (n = 7 cells), grey dotted line is for cells incubated in cytochalasin-D at 500 nM starting at t = 5 min (n = 9 cells), and thin black line is for cells that were “whiffed” with cytochalasin-D at 500 nM starting at t = 5 min (n = 5 cells). Large black pentagram positioned at t = 20 min represents a separate experiment where control cells’ apparent stiffness, E*control (n = 13 cells), was compared to that of cells incubated for 15 min in cytochalasin-D at 1000 nM, E*cyto-D (n = 18 cells). The y-coordinate of the pentagram is E*cyto-D/E*control. (b) Time evolution of BAEC relaxation parameter α. The same notation as in panel a is used. (c) Time derivative of data in panel a: left column is control case, middle column represents cells incubated in cytochalasin-D, right column represents cells “whiffed” with cytochalasin-D. Data are mean ± s.e.m. Slopes in panel a were compared using the ANOCOVA test. *** indicates p < 0.001. (d) Time derivative of data in panel b. Data are mean ± s.e.m. The same notation as in panel c is used.

