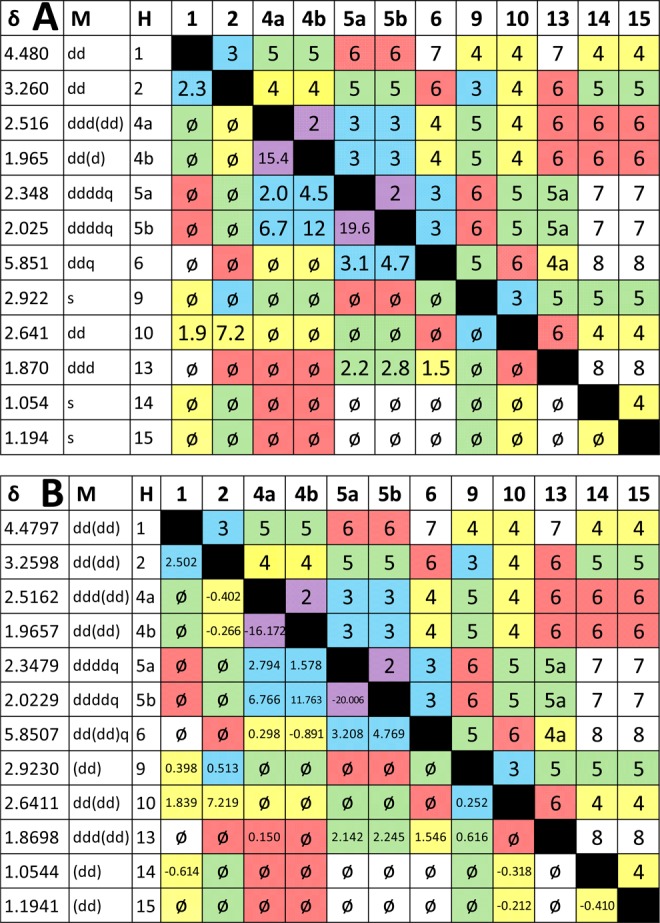
Figure 3.

(A) Results of reprocessing the FID from the 800 MHz 1D 1H NMR spectrum of aquatolide displayed on a J correlation map. The number of bonds separating two coupled nuclei are color-coded: violet = 2J, blue = 3J, yellow = 4J, green = 5J, and pink = 6J. The gaps in the colored fields of the lower left indicate the limitation of achievable coverage with manual spin analysis. Whereas all couplings of ∼1 Hz or more could be readily extracted, determination of the long-range J-couplings typically requires a computational approach. (B) Final J-correlation map, termed quantum interaction and linkage table (QuILT; see main text), achieved by HiFSA fitting of the archived 800 MHz 1D 1H NMR data of aquatolide. Multiplicities in parentheses are less than ∼1 Hz. Couplings less than absolute value of 0.10 Hz are given as “⌀” rather than being reported as blank cells, which would indicate them being unknown or undetermined.
