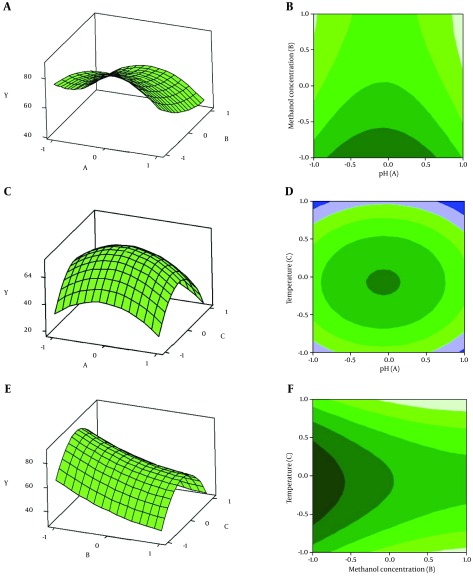
Figure 4. Response Surface Plot and Its Contour Plot Described by the Y Model.
A and B show the effect of pH (A) and methanol concentration (B) on phytase activity; C and D show the effect of pH (A) and temperature (C) on phytase activity; E and F show the effect of methanol concentration (B) and temperature (C) on phytase activity.

