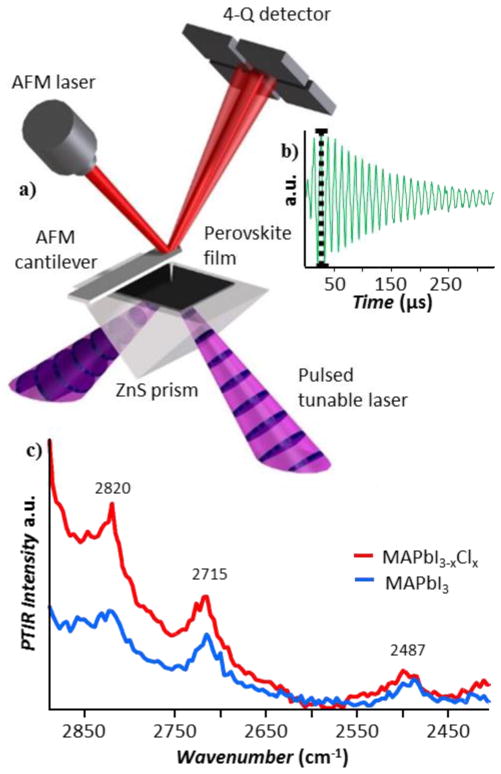
Figure 2.
PTIR experimental Setup: a) Schematic of the PTIR measurement: if the sample absorbs the laser pulses (discs in purple cones) it rapidly expands deflecting the AFM cantilever whose position is monitored by the four-quadrant detector. b) The maximum peak to peak deflection (black dotted line) is proportional to the energy absorbed by the sample and provides the PTIR signal intensity. c) Representative vibrational PTIR spectra for MAPbI3 (blue) and MAPbI3-xClx (red) films.

