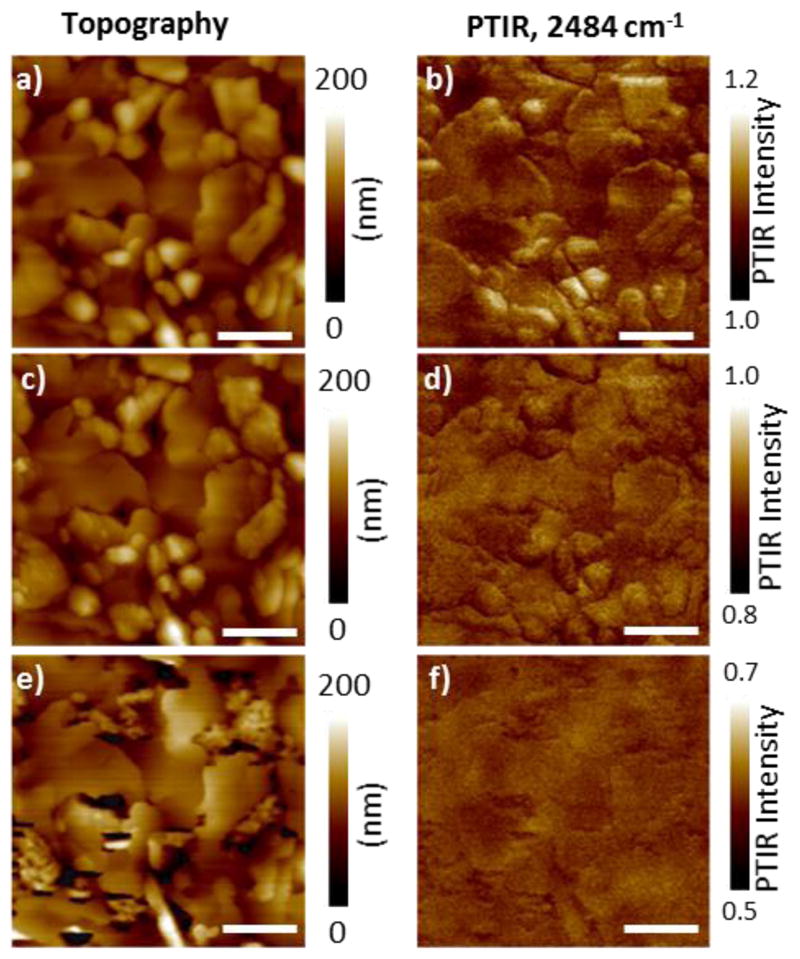
Figure 5.

Stability of the MAPbI3-xClx perovskite: Pairs of AFM topography and PTIR vibrational absorption images at 2484 cm−1 (corresponding to a combination of NH3 symmetric bending CH3 rocking)44 for the MAPbI3-xClx sample before annealing (a and b), after annealing at 140°C for 10 min (c and d) and after annealing at 140°C for additional 50 min (e and f). The intensity of the PTIR maps are plotted with the same scale range and all scale bars are 1.0 μm.
