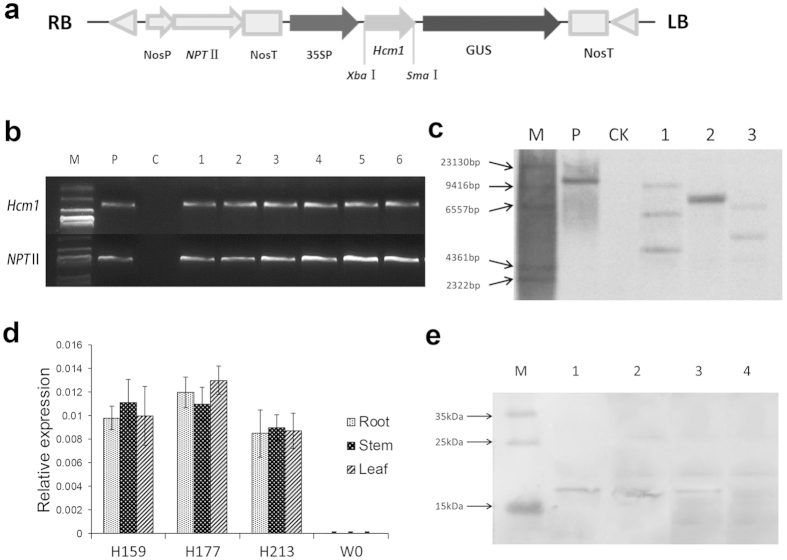
Figure 1. Molecular analysis of Hcm1 in transgenic plants.
(a) Schematic representation of recombinant plasmid pBI121-35S::Hcm1-NPTII. RB and LB represent the right and left borders of T-DNA, respectively. (b) PCR analysis of the transgenic plants to detect the 35S: Hcm1 and the NPTII genes. M: Marker DL2000; P: plasmid as positive control; C: non-transformed plant W0; Lanes 1–6: positive transgenic plants. (c) Southern blot analysis of Hcm1 insertions in transgenic lines. Genomic DNA was digested with EcoRΙ and hybridized with a 0.75-kb fragment of NPTII. M: Marker, P: positive control pBI121, CK: non-transformed W0 plant, lanes 1–3: T6 generation homozygous transgenic lines H159, H177, and H213. (d) qRT-PCR analysis of expression levels of Hcm1 in roots, stems and leaves of Hcm1-transformed (lines H159, H177, and H213) and parent W0 plants. Error bars represent the standard deviation of triplicate experiments, and the EF-1α gene was amplified as a control. (e) Western blot analysis of Hcm1 in transgenic plants. M: PageRulerTM Prestained Protein Ladder, lanes 1–4: Three T6 generation homozygous transgenic lines (H159, H177, and H213) and parent W0.

