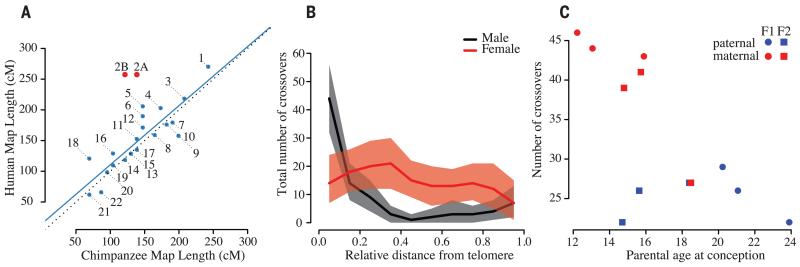
Fig. 2. Parameters of cross-over.
(A) Scatterplot showing the relationship between total genetic map length inferred for chromosomes and their homologs in humans. Black dotted line indicates the identity relationship; blue line indicates best linear fit (excluding chromosomes 2A and 2B). (B) Relationship of recombination rate to relative telomere proximity demonstrates a telomeric effect in males, which is absent in females. (C) Relationship between parental age and the number of cross-over events in mothers and fathers for the two family groups.

