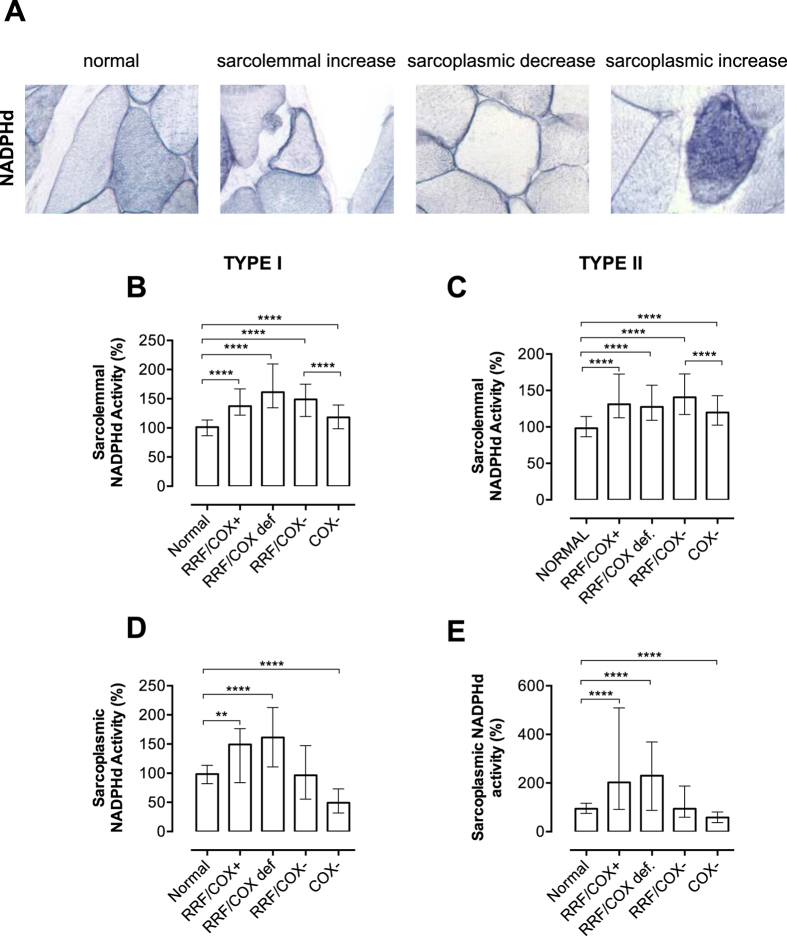
Figure 3. Quantification of NADPHd activity.
Sarcolemmal and sarcoplasmic NADPHd stainings are shown in normal and abnormal fibres (A). Note that normal fibres have a sarcolemmal staining and type I fibres have darker sarcoplasmic staining. We demonstrate the three types of alterations in NADPHd activities: sarcolemmal increase, sarcoplasmic decrease and sarcoplasmic increase. Quantification of NADPHd activity considering the different types of mitochondrial abnormalities show that sarcolemmal activity is increased in all groups with mitochondrial abnormalities (mitochondrial proliferation or COX deficiency, B,C). Sarcoplasmic activity is increased in RRF/COX+ and RRF/COXdef fibres, and reduced in COX− fibres when compared to normal fibres. The total numbers of myofibres analysed in each group are shown in Table 2. Data were analyzed by Kruskal-Wallis test followed by Dunn’s post hoc test: ****P ≤ 0.0001, **P ≤ 0.001. Bars are showing median and interquartile range.

