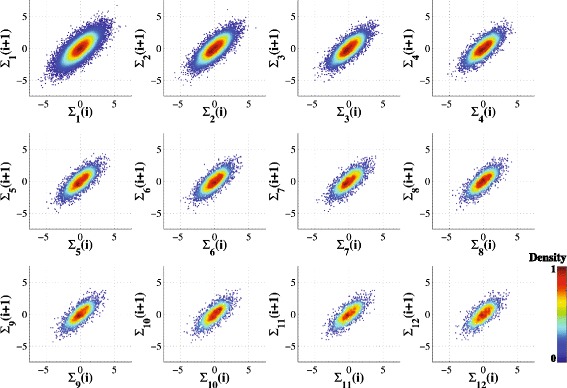
Fig. 3.

Multiscale Poincaré (MSP) plots of synthetic 1/f noise time series (20,000 data points) for scales s = 1 to 12. Note that Σ s (i) represents the ith data point of the coarse-grained time series for scale s. The data points are colorized based on their estimated normalized probability density function (see text and Fig. 1)
