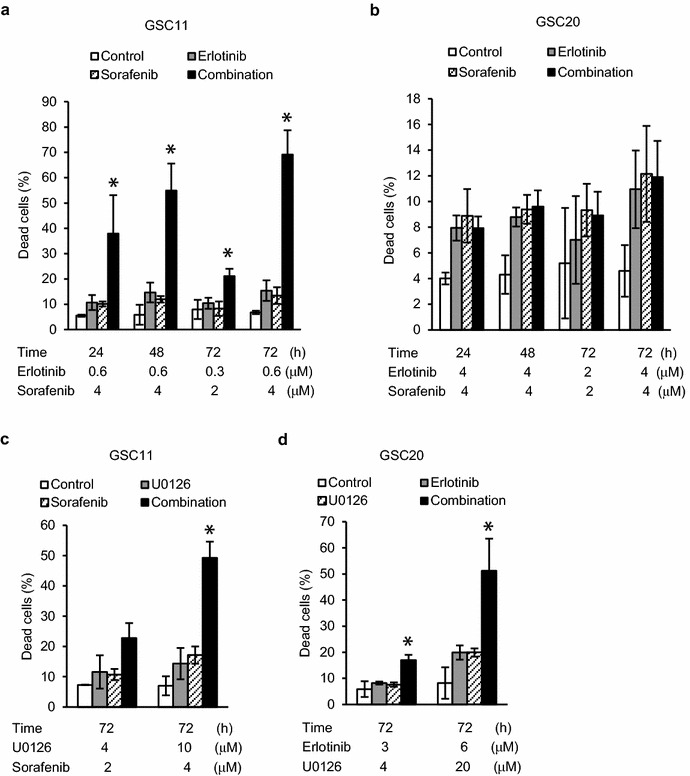
Fig. 2.

Increases of cell death by combination treatments in glioma tumor-initiating cells. GSC11 (a and c) and GSC20 (b and d) cells were treated with vehicle (control) or indicated drugs for indicated periods of time and analyzed with trypan blue dye exclusion assay to calculate percentage of dead cells. Data are expressed as the means of at least two independent experiments done in duplicate. Error bars are 95 % confidence intervals. *means p < 0.05 in ANOVA and Tukey’s post hoc test in comparison of combination treatment group with any of the other groups
