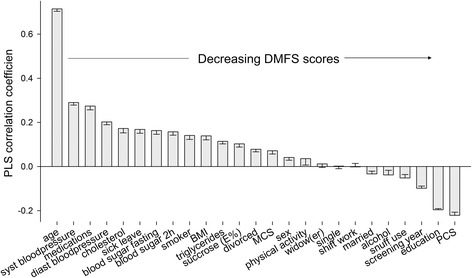
Fig. 1.

Column loading plot from PLS modelling of DMF surfaces at baseline. DMFS (continuous measure) was employed as the dependent variable and factors potentially associated with the risk of developing caries were the independent variables. The strength and directions of the associations are shown as PLS correlation coefficients on the y-axis. Factors with 95 % CIs that do not include zero are statistically significant. Those with PLS coefficients >0 are associated with more caries (to the left; i.e., the higher the age, the higher the caries score) and those with negative coefficients are associated with fewer caries (to the right; i.e., the higher the PCS score, the lower the caries score)
