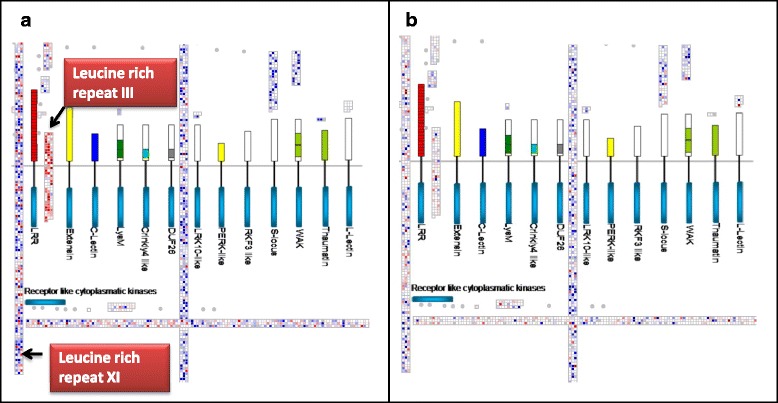
Fig. 5.

Visualization of differentially expressed receptor-like kinase genes with MapMan. The receptor kinase bin 30.2 is illustrated. a Leaf and (b) Roots. Subfamilies III and XI are indicated. The figure was constructed using log2-transformed ratios of induced versus control. The most intense colors represent 8-fold change. Blue denotes increase and red decrease
