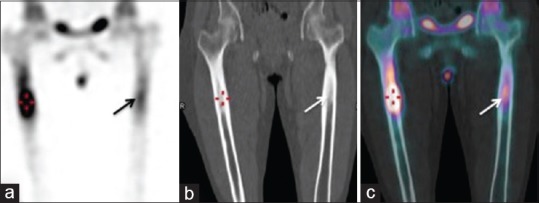
Figure 4.

Coronal single photon emission computed tomography image (a) increased focal intense tracer uptake involving diaphysis of both femorii (triangulate – right; arrow – left) proximally, more on the right side, showing intramedullary sclerosis on corresponding low dose coronal CT (b), which is confirmed on fused SPECT/CT images (c)
