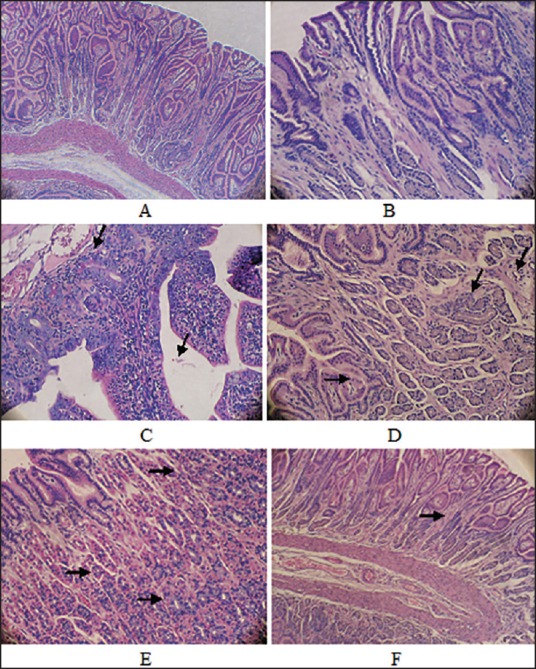
Figure 4.

Histology of pyloric mucosa's (H and E, ×40). (a) Control group (b-e) Infected groups (b) Discontinuity of the epithelium, interstitial edema, widening of the bile duct, and congested blood capillary (c) The cellular infiltration, disorganization, reactive atypia and congested blood (d) The duct wider, multiple vaculations, interstitial edema between glands and mononeuclear cell infiltration (e) Cytoplasmic acidophilic increased (f) Treated groups showing a decrease in the widening of the bile duct and in cellular infiltration and the absence of inflammatory cells
