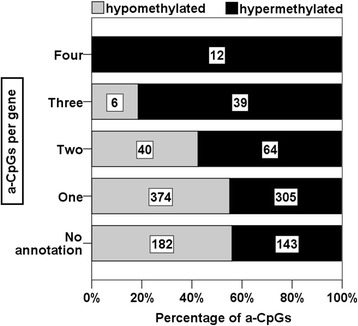
Fig. 1.

Numbers of aging-associated CpG sites (hits) per gene in regard to hypermethylation and hypomethylation is visualized as bars. Aging-associated hypermethylation was more frequent within genes with more association hits. First, the genes were categorized into groups based on the number of hypermethylated or hypomethylated a-CpG hits per gene. Next, the frequencies of hypermethylated and hypomethylated a-CpGs within the groups were calculated. The number of a-CpGs for each group is shown inside each bar
