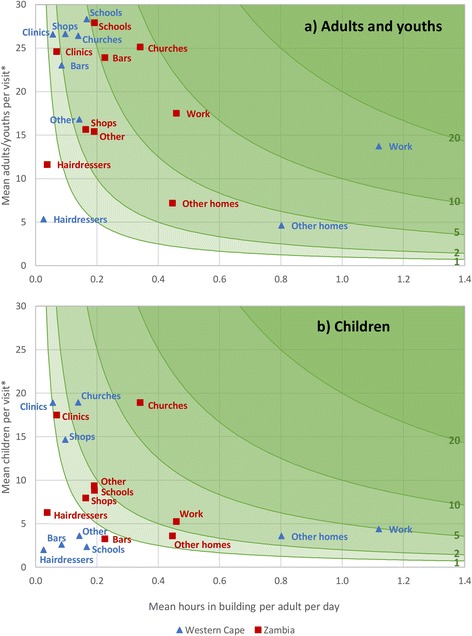
Fig. 1.

Reported contact hours per adult per day, by building type and site. Mean number of total contact hours with a adults and youths and b children, in each building type per adult per day, by site. This is product of (x axis) the mean number of hours in the building type per adult per day and (y axis) mean number of adults/youths or children present per visit. Green lines indicate contours of 1, 2, 5, 10, and 20 mean total contact hours with adults/youths or children, per adult per day. *Mean number of adults/youths and children per visit is weighted according to visit duration. Values therefore differ slightly from those presented in Table 1
