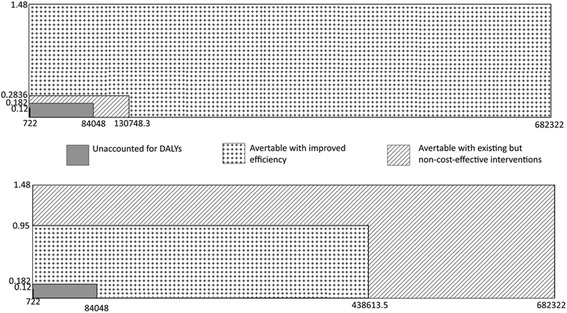
Fig. 6.

Subdivision of existing DALYs due to TB for South Africa. In the first graph, reductions from improved efficiency are calculated first, followed by reductions through use of existing but non-cost-effective interventions. In the second graph, these reductions are applied first, followed by the reductions from improved efficiency
