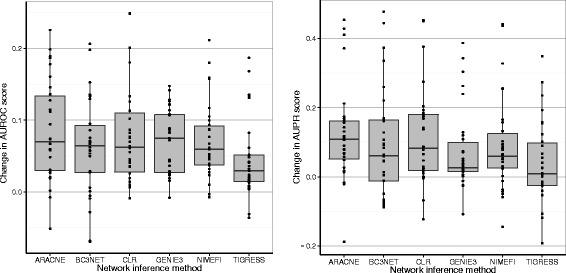
Fig. 3.

Change in AUROC and AUPR scores after applying Netter. Change in AUROC and AUPR scores after applying Netter on all datasets except DREAM-5 which are shown in Table 2. The different bars represent the network inference algorithm used to create the initial network. Each dot on the figure is a different re-ranked network and is the result of a single Netter re-ranking procedure consisting of 100 averaged independent optimization runs
