
Fig. 2.
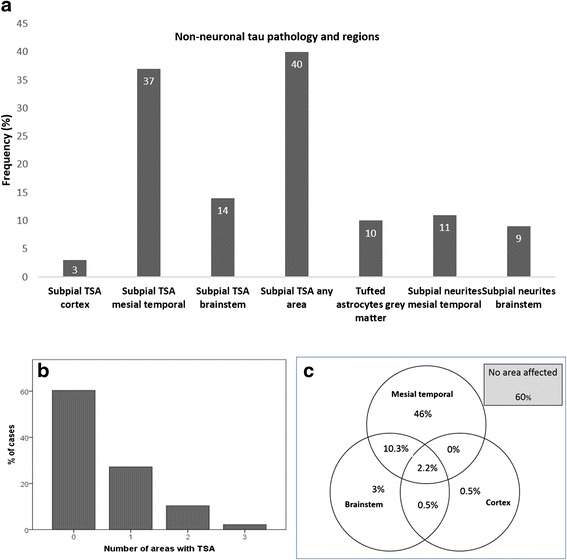
a. Frequencies of glial and subpial neuritic tau pathologies. b. Distribution of number of areas involved by TSA. c. Venn diagram showing the distribution of areas affected with TSA
Official websites use .gov
A
.gov website belongs to an official
government organization in the United States.
Secure .gov websites use HTTPS
A lock (
) or https:// means you've safely
connected to the .gov website. Share sensitive
information only on official, secure websites.
a. Frequencies of glial and subpial neuritic tau pathologies. b. Distribution of number of areas involved by TSA. c. Venn diagram showing the distribution of areas affected with TSA