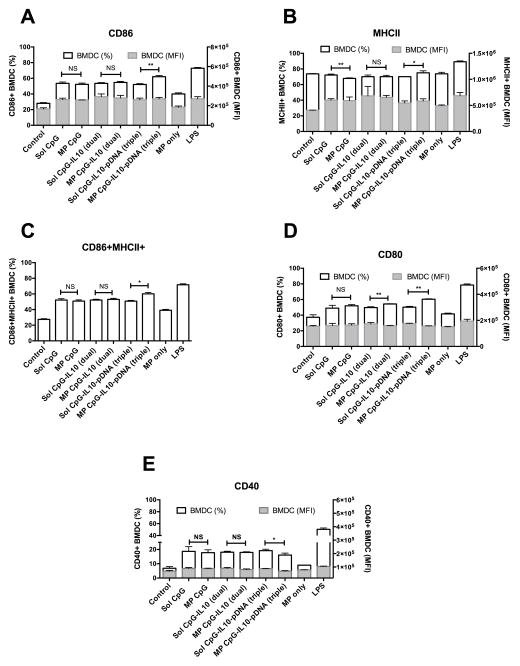
Fig. 3.
Surface expression of activation and maturation markers in primary BMDCs. Bar graph showing percentage and median fluorescent intensity (MFI) of CD11c+ BMDCs expressing A) CD86, B) MHCII, C) both CD6 and MHCII, D) CD80 and E) CD40 following the treatment with different formulations of CpG, IL10-siRNA and pDNA each at 1 ug/ml concentration for 48hrs; *P<0.05 and **P<0.01 when compared between the groups.

