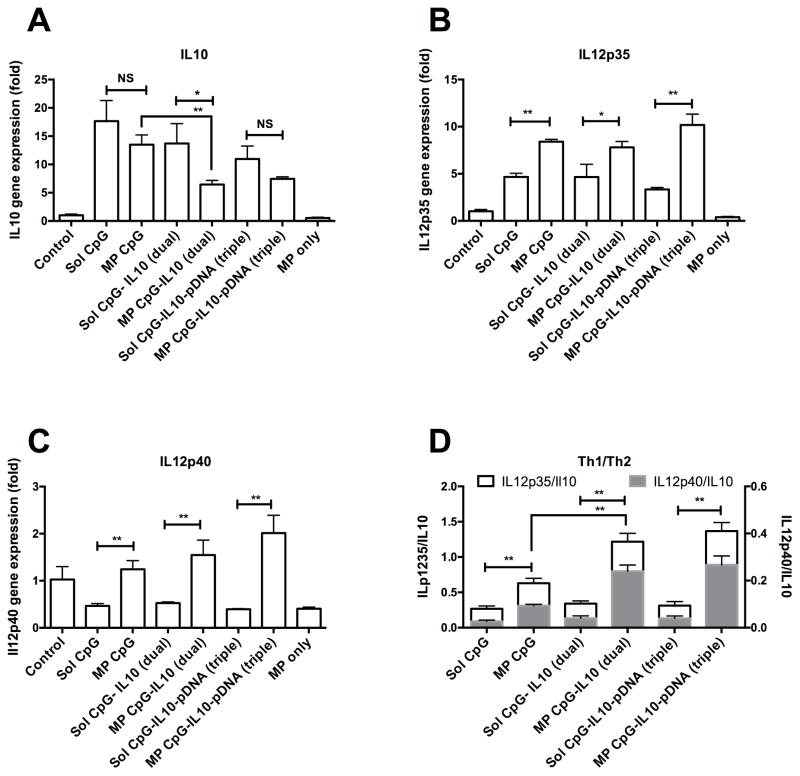
Fig. 6.
Cytokine gene expression in BMDCs. Bar graph showing A) IL10, B) IL12p35 and C) IL12p40 gene expression in BMDCs treated with different samples for 48hrs. D) Bar graph showing ratio of Th1 cytokine genes, IL12p70 and IL12p40 and Th2 cytokine gene IL10; *P<0.05 and **P<0.01 when compared between the groups.

