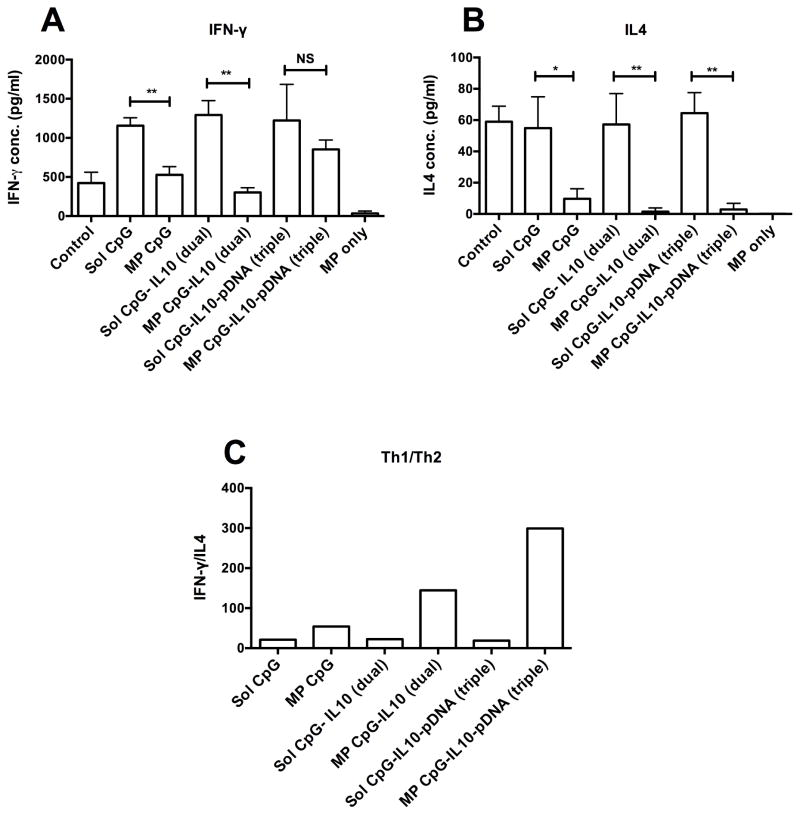
Fig. 7.
Cytokine profile of allogenic MLR. Bar Graph showing A) IFN-γ and B) IL4 secretion in culture supernatant after 96 hrs of an allogenic MLR between CD4+ T cells (C57BL/6 origin) and BMDCs (Balb/C origin) treated with different samples for 48 hrs. C) Bar graph showing ratio of Th1 cytokine, IFN-γ and Th2 cytokine, IL4; *P<0.05 and **P<0.01 when compared between the groups.

