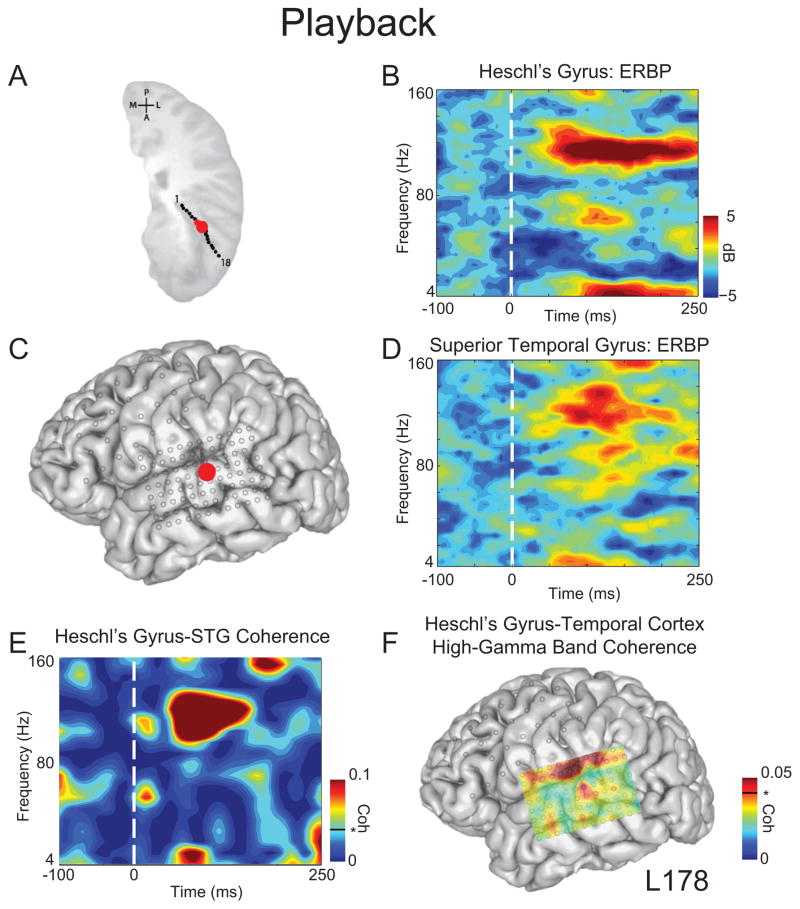
Figure 1.
Coherence between Heschl’s gyrus and superior temporal gyrus during playback. A) Depth contacts in Heschl’s gyrus; selected contact in red. B) Event-related band power (ERBP) for Heschl’s depth contact demonstrated low frequency and high-gamma band (70–150 Hz) activity during playback. C) Temporal grid; STG selected contact in red. D) ERBP for STG demonstrated prominent high-gamma activity during playback. E) Coherence between Heschl’s gyrus and STG was prominent in high-gamma frequencies. F) Distribution of high-gamma coherence (0–250 ms post-voice onset) between Heschl’s gyrus contact and all temporal grid contacts. Coherence values above 0.04 (black line) are significant at p < 0.05. All time-frequency plots are aligned to voice onset.

