Figure 2.
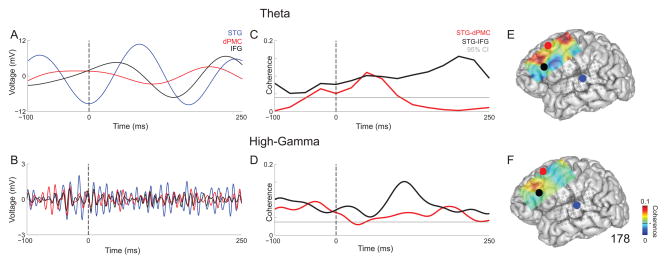
Local field potentials from individual contacts in STG (blue), dorsal premotor cortex (dPMC; red), and inferior frontal gyrus (IFG; black) during vocalization from subject 178 for A) theta and B) high-gamma band. Field potentials are average across trials. Coherence for STG-dPMC (red) and STG-IFG (black) during vocalization from subject 178 for C) theta and D) high-gamma band. All time-frequency plots are aligned to voice onset. The gray line represents the 95% confidence threshold for coherence. Average coherence values for each frontal contact relative to STG from 0–250 ms post-voice onset in E) theta and F) high-gamma band. STG is shown by the blue circle, dPMC in red, and IFG in black. The 95% confidence interval for coherence is the black line on the color bar.

