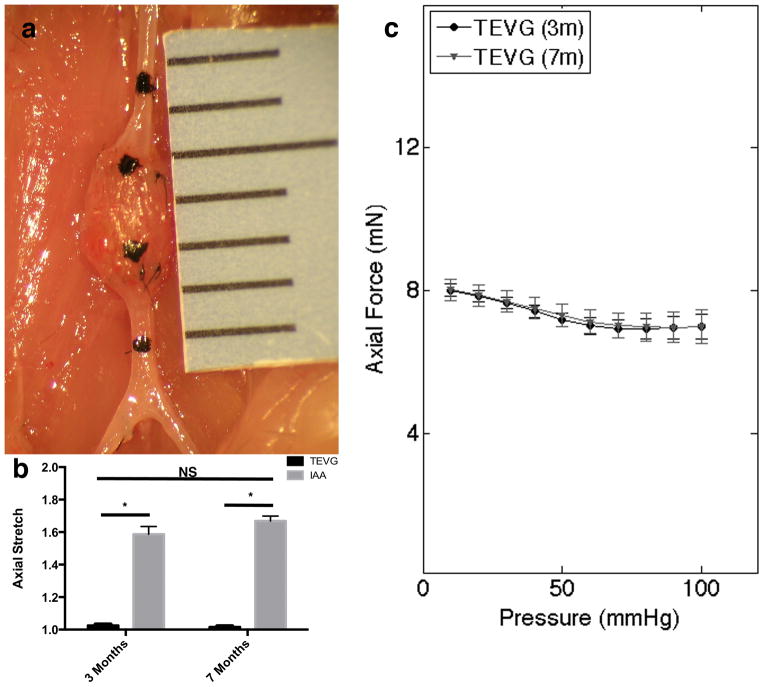
Figure 4.
Evaluation of axial stretch and force. (a) Representative image of TEVG at explant. Note: India ink marked proximal IAA, proximal TEVG, distal TEVG, and distal IAA. (b) Axial stretch ratio of the loaded and unloaded state measured at 3 (n=9) and 7 (n=6) months expressed as mean ± SD. (c) Axial Force during pressure-diameter curves at 3 and 7 months at in vivo axial stretch expressed as mean ± SEM.

