Figure 3.

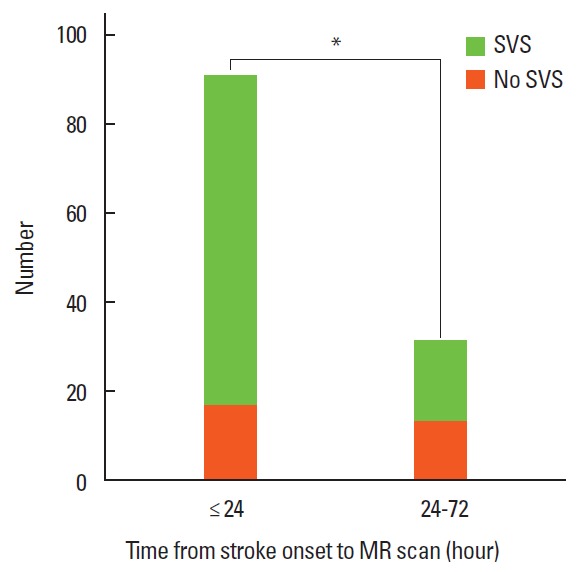
Frequency of susceptibility vessel sign (SVS) on susceptibility-weighted imaging in cardioembolic stroke patients in the time from stroke onset to MR scan. *P=0.009 by Pearson’s chi-square test.

Frequency of susceptibility vessel sign (SVS) on susceptibility-weighted imaging in cardioembolic stroke patients in the time from stroke onset to MR scan. *P=0.009 by Pearson’s chi-square test.